
The 1 to 10 scale is alternatively called the opinion rating scale. This scale falls under Likert scaling method used to collect customer feedback. In this blog, we will discuss what is the 1 to 10 rating scale survey and why it is effective to collect customer feedback. Learn about the types of 1 to 10 scale, its common uses with examples and how it improves response quality.
What is the 1 to 10 Rating Scale?
A 1 to 10 rating scale is a quantitative scale that asks respondents to rate their experience or satisfaction level on a scale from 1 to 10. This scale will assess responses based on two extreme spectrums of experiences: highly agree-highly disagree, very satisfied-very unsatisfied or not likely-highly likely etc.
For instance:
- 1 indicates dissatisfaction or the lowest value.
- 10 indicates maximum satisfaction or the highest value.
Tip to maximize survey response rate: Combine with visual aids ( a scale or a pop-up) to increase response rates up to 15%.
The 1-10 Likert scale survey is used in the following situations:
- Evaluating sentiment: Understanding satisfaction or dissatisfaction levels.
- Measuring change: Tracking improvements over time in products or services.
- Comparative analysis: Comparing feedback across segments or demographics.
Pro Tip: Use a 1-to-10 opinion scale when you need detailed feedback. Avoid it for quick, binary decisions (e.g., “Would you recommend this product?”).
Types of 1 to 10 rating scales
The 1 to 10 rating scale (also known as opinion scale) survey is widely used because it allows respondents to express subtle differences in their opinions or feelings. It’s commonly used to gauge satisfaction, performance, or likelihood to recommend.

Here are some ways that can distinguish the numbers on a 1 to 10 opinion scale survey.
The extreme labels at each end are used to clearly define the highest and lowest points of the scale. Here are some common types of labels used:
- Satisfaction
- 1: “Very Dissatisfied” / 10: “Very Satisfied”
- 1:”Not Satisfied at All” / 10: “Completely Satisfied”
- Agreement
- 1:”Strongly Disagree” / 10: “Strongly Agree”
- 1:”Completely Disagree” / 10: “Completely Agree”
- Likelihood
- 1:”Not Likely at All” / 10: “Extremely Likely”
- 1:”Would Never Recommend” / 10: “Would Definitely Recommend”
- Quality
- 1:”Very Poor” / 10: “Excellent”
- 1:”Low Quality” / 10: “High Quality”
- Frequency
- 1:”Never” / 10: “Always”
- 1:”Rarely” / 10: “Very Frequently”
- Importance
- 1:”Not Important at All” / 10: “Extremely Important”
- 1:”Low Priority” / 10: “High Priority”
1 to 10 Rating Scale Questions on Different Use Cases
Here are the popular scenarios where the popular 1-10 rating scale is used across industries.
1. To measure customer satisfaction metrics
Customer satisfaction metrics is a quantitative way of collecting feedback across touchpoints. It can denote experiences based on interactions, experiences and transactions.
However, one can also use this 1 to 10 opinion based scale for a standalone feedback.
- On a scale of 1 to 10, how satisfied are you with our customer support?
- Rate your experience with the company (1 is completely dissatisfied and 10 is completely satisfied).
- Rate the in-store experience on a scale of 1 to 10 ( 1 being very poor and 10 being excellent).
2. The measure customer advocacy with Net Promoter Score scale
The Net Promoter Score (NPS) is a market-standard used Likert scale. The Net Promoter Score survey is mapped on an 11-point Likert scale. The scale asks customers a single question on a 1 to 10 rating scale.
NPS rating scale will gauge the likelihood of recommending a certain product to your friends or family. This strict format segregates respondents into promoters, detractors and passives.
- The NPS scale is also known as Relational Net Promoter Score (rNPS) survey. The rNPS measures a customer’s relationships and loyalty toward a brand, product, or service.
- tNPS or transactional NPS focuses on collecting customer feedback after a specific interaction or transaction.
- eNPS or employee NPS measures employee satisfaction and loyalty within an organization. The framework will assess how likely employees are to recommend their workplace.
3. To rate tangible product features
The 10-point Likert scale is useful to assess detailed product features. It is used to understand how a certain product feature benefits users.
For example, a washing machine can come with a special child lock system. This feature may not be available for every model. A 1-10 opinion survey scale can understand if consumers might be more inclined to opt for this particular security feature. Here are some examples:
- On a scale of 1 to 10, how likely are you to purchase our products again in the future?
- How would you rate the performance and reliability of our products?
(1 = very poor, 10 = excellent) - A security lock feature should be implemented in the latest models of washing machines (1= strongly disagree, 10= strongly agree).
4. To collect transactional customer feedback
Touchpoints vary across industries based on the customer’s journey, with some journeys being longer (such as automotive or banking). A 1–10 Likert scale effectively collects feedback at key stages, such as post-purchase or service interactions. For automotive industries, capturing feedback on experiences like first drives or servicing helps measure satisfaction and emotional responses. Responses on this scale offer areas for improvement, providing both qualitative and quantitative insights.
A 1-to-10 rating scale can be used for various touchpoints such as
- To gauge a post-purchase experience. This can determine if people will return to the brand or choose a competitor.
- After contacting the customer support to close the feedback loop. This will determine if the problem was resolved or it will lead to a churned consumer).
- After getting a product demonstration. This will determine if the person will purchase the product or choose another brand.
- To assess the satisfaction metrics after using the product during its trial period. This can dictate its long term purchase or shifting to a competitor product.
5. To collect data via market research
Market research uses a variety of methods to collect respondent data. It includes both qualitative and quantitative methods of surveys. This makes the 1-to-5 rating scale and the 1-10 rating scale survey effective. Market research tools that offer 1-10 opinion scale surveys make it easier to analyze and compare customer feedback to gauge survey response.
To get reliable customer data, add sentimental analysis to assess a broad range of opinions, preferences, and perceptions. This approach helps in conducting statistical analysis, identifying trends, and making informed, data-driven decisions.
- For example: On a scale of 1-to-10, how well does our product compare to competitors in the market?
Why Choose the 1-10 Rating Scale Survey?
1. Universal appeal
The scale is intuitive and universally understood, enabling respondents to quickly share their feedback without overthinking.
2. Detail oriented
The 1-to-10 rating scale question captures nuances in sentiment. This offers detailed insights into customer or user preferences, more than a dichotomous or a binary yes/no scale.
3. Ease of analysis
It provides numerical data that can be easily quantified, tracked over time and used for statistical analysis.
4. Versatile applications
This scale adapts well to various contexts:
- Net Promoter Score (NPS): Often derived from 1-10 responses to gauge loyalty.
- Product Feedback: Rating features or performance.
- Service Quality: Measuring customer satisfaction.
How to Get Maximum Response Rate from the 1 To 10 Rating Scale Survey?
The 1 to 10 Likert rating scale is an efficient scale. However, here are some design tips to maximize this scale for a high survey response rate:
1. Choose pre-designed rating scale templates
Pre-designed rating scale templates are crafted by marketing professionals. The rating scales are tried and tested across samples of respondents. Pre-designed templates save you the hassle of creating surveys from scratch. Simply customise the message as per your market research goals. Merren offers pre-designed templates that are compatible across any device or platform.
Avert survey response bias: Pre-designed templates help you avert response bias. If you are formulating questions from scratch, ensure questions are neutral and unbiased. For instance, avoid leading phrases like, “Don’t you think our service is exceptional?”
Provide labels for ratings: Help respondents by offering clarity:
- 1-3: Poor
- 4-6: Average
- 7-10: Excellent
2. Do not ask double barrelled rating questions
Double-barrelled statements ask two questions at once. We recommend breaking the questions into two parts to obtain two clear answers for each situation.
Example of a double-barrelled statement: “Do you think our website is easy to use and visually appealing?”.
This question asks about both usability and visual appeal. The user can agree with its visual appeal but not the usability or vice-versa. Keep each feature as a separate question. This will help you improve on standalone aspects of the website.
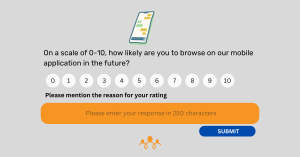
3. Add an open-ended survey question
An open-ended survey question can help marketers and CX professionals obtain open-ended survey responses. You can understand why people opt for a certain rating, gauge their emotional experiences, opinions and expectations. A collection of numeric and non-numeric responses can enhance the quality of data.
Example: “What influenced your rating the most?”

4. Choose responsive survey channels for customer feedback
Your customers use various social media channels to interact with a brand. This includes messenger apps and social media channels. Ensure that your scales are dynamic to use and are compatible with WhatsApp, Facebook messenger, website chatbots or dynamic emails. This makes the scale more effective and responsive. However, the USA now has 100 million WhatsApp users. Merren’s 1-to-10 scale is compatible with any device that uses WhatsApp. Collect critical numerical data with Merren’s native WhatsApp surveys.
Pro Tip: Optimise the feedback form so that it runs smoothly on all mobile devices. Ensure the scale is easy to navigate on smaller screens. Using 1-10 rating surveys via Merren can help you overcome device based barriers.
5. Keep surveys short to make it responsive
Long survey questions can cause significant survey fatigue. You will get more survey drop-out rates over completion. Longer rating scales can be prone to confusion and error if you overdo it while curating customer feedback questionnaires. Stick to the goal of the research to avoid confusing participants. Shorter questionnaires can obtain quick and genuine feedback
6. Integrate results with customer experience tools
Use charts or graphs to interpret trends effectively. Tools like heat maps can make your data more actionable. Implement tools like Merren to automate survey campaigns and data collection so that you can view all customer data in a single dashboard.
How to analyze responses from the 1 to 10 rating scale surveys?
1.Calculate the average (mean) rating
Find the sum of all the responses and divide by the number of responses to find the average score. Identify the middle value in the range to understand the most typical rating, which can help if there are outliers.
2. Classify ratings into categories
Group scores into ranges, such as low (1-3), medium (4-6), and high (7-10). Simplify interpretation and focus on trends in satisfaction levels. Pay special attention to very high (9-10) and very low (1-2) ratings. Identify strong positive or negative feedback and reach out to the customers who need assistance.

3. Standard rating scales have established category
Net Promoter Score has an established category divided into promoters, passives and detectors. Promoters are grouped between 9-10, passives are grouped into 7 or 8, and detractors are between 1-6 to assess overall brand loyalty.
How does the 1-10 rating scale compare against other feedback methods?
1. 1 to 5 rating scale survey
The 1 to 5 Likert rating scale is simple and quicker for respondents. It is less detailed than the 1-to-10 scale
Best For: In-app pulse surveys where customers can rate a delivery service, product quality instantly.
2. Smiley face ratings
Smiley face survey scales are visually engaging and intuitive. However, it is meant for collecting quick data based on certain interactions or transactions. It is not applicable for complex data analysis.
Best For: Feedback from children or low-literacy groups.
3. Dichotomous scales (Yes/No)
The dichotomous scale (also known as binary scale) survey is clear and direct in terms of options (yes/ no. like/ dislike, true/ false). However, it misses nuances in sentiment. Binary scales are ideal to get quick answers that are easy to analyze.
Best For: Situations that need clear-cut, binary choices. Ideal to assess preferences, agreement with a statement.
Conclusion
A qualitative 1-10 rating scale can give you in-depth numeric data that goes beyond a 5-star or a 5-point rating scale. You can differentiate between happy, unhappy or neutral customers. This gives you a chance to attend to unhappy and neutral customers while retaining happy customers.
Merren is an AI-powered platform that conducts research from start to the finish. Curate your research for your industry hassle free all done for you by Maya AI. Focus on the strategies while MAYA AI does the heavy lifting. Explore Maya AI’s capabilities here.