


Ad research is the structured process before committing media budget to an advertising campaign. It involves gathering audience intelligence, analysing competitor campaigns and validating creative concepts prior.
This guide walks through the complete ad research process, step by step. Whether the budget is $50,000 or $5 million, the methodology holds. What changes is the scale of the tools and the sample sizes involved.
New to advertising research? Start with What is Advertising Research.
Why Ad Research Is Non-Negotiable in 2026
In the US alone, digital ad spending crossed $300 billion in 2025. In India, digital advertising is growing at over 15% year-on-year, with brands competing fiercely on Instagram, YouTube, OTT platforms, and Connected TV.
With more channels and more noise than ever before, the cost of running an ad is the media placement cost multiplied across every impression where the message failed to land. For a single national TV campaign in India, media placement can run between $1.2 million to $2.4 million. In the US, a marquee digital campaign easily clears $500,000 in media spend.
Media placement is almost always five to ten times more expensive than the ad itself. Spending an extra $12,000 on research to make sure the creative works is dramatically cheaper than pouring $240,000 of media money behind an ad that fails.
Brands that consistently test and research their advertising build gradual institutional knowledge. They know what language resonates with their audience, which emotional triggers drive action and which messaging formats convert. That knowledge compounds.
The 7-Step Ad Research Process
1. Define the research objective
Before opening a single tool or briefing a research agency, the most important question must be answered: what decision will this research inform?
Effective ad research is decision-driven. The three most common decisions it needs to support are:
Pre-campaign research — Which creative concept should be produced? Which message should be amplified? Who is the precise target audience and what do they actually care about?
In-flight research — Is the campaign performing? Is the message landing as intended, or has something been lost in translation between the brief and the execution?
Post-campaign research — What worked, what did not, and what does the brand carry forward into the next campaign?
The research objective also determines whether what is needed is advertising research (evaluating the effectiveness of advertising itself) or market research (understanding the broader consumer landscape). These are related but different disciplines see Advertising Research vs Market Research for a detailed breakdown.
Actionable framework: Write the decision statement in one sentence before beginning. Example: “This research will determine which of three creative concepts generates the strongest purchase intent among urban Indian women aged 25–35 in the personal care category.” Every research decision that follows — methodology, sample size, question design — flows from that sentence.
2. Build the target audience profile
Demographics are the starting point: Age, gender, income bracket, and geography are table-stakes filters. They tell you who might see the ad. They do not tell you who is likely to act on it.
The layers that actually predict ad response are:
Psychographic profiling: What does the audience believe? What are their aspirations, anxieties, and cultural reference points? A 28-year-old in Bengaluru working in tech and a 28-year-old in Ludhiana running a family business share the same demographic profile. Their advertising triggers are almost entirely different.
Behavioural data: What has the audience already purchased? What content do they consume? Which platforms do they spend the most time on? Behavioural data is available through first-party sources (CRM data, website analytics, email engagement), second-party sources (platform data from Meta, Google), and third-party data providers.
Jobs-to-be-done framework: Popularised by Clayton Christensen, this framework asks: what is the audience trying to accomplish, and what is the barrier currently stopping them? Ads that speak directly to a job-to-be-done consistently outperform ads that lead with product features.
For India-specific nuance: Indian consumers demonstrate significantly higher levels of brand trust sensitivity and peer recommendation influence compared to US audiences. Research consistently shows that social proof elements (testimonials, ratings, and community endorsement) carry disproportionate weight in Indian advertising effectiveness. Bake this into the research brief.
Tools for audience research:
- Google Analytics 4 audience reports (free)
- Meta Audience Insights (free, accessible via Ads Manager)
- Semrush Market Explorer (paid, excellent for US market intelligence)
- SimilarWeb (free tier available, useful for digital behaviour data)
- First-party surveys via Merren’s WhatsApp surveys. Particularly effective in India, where WhatsApp penetration exceeds 500 million users
3. Conduct qualitative research with real consumers
Qualitative research for advertising serves two core purposes:
Concept development: Before spending a single dollar on production, qualitative sessions help identify the language, emotional territory, and visual cues that actually resonate. Marketers often discover that the message they planned to use is not the message consumers find most compelling. This discovery at the concept stage costs a fraction of what it costs to make after production.
Creative diagnostics: Once a rough cut or storyboard exists, qualitative feedback identifies specific elements that are confusing, off-brand, culturally insensitive, or simply dull. A skilled moderator will surface what a survey cannot: the specific moment in an ad when a viewer’s attention drifts, the tagline that sounds clever in a boardroom but lands as jargon with real consumers, the visual that triggers the wrong association.
Consumer interview methodology for ad research is a deep topic in its own right. See the dedicated guide on Consumer Interviews for Advertising Research for sample questions, recruitment approaches, and analysis frameworks.
In-person vs. digital qualitative research: Traditionally, qualitative ad research required central location testing (CLT) bringing respondents to a facility. This is still valuable for testing ads with visual complexity or emotional nuance. However, AI-moderated digital qualitative interviews have dramatically lowered the cost and geographic reach of this methodology, making it accessible to brands that previously could not afford it.
Sample guidance: For a qualitative concept test, 8–12 in-depth interviews or 2–3 focus groups of 6–8 participants per audience segment typically yields enough data to identify primary themes. In the Indian market, account for language diversity. A concept that works in English may need separate qualitative validation in Hindi, Tamil, or Bengali depending on the campaign’s geographic scope.
4. Analyse competitor advertising
Understanding what competitors are doing and what they are not doing is one of the highest-leverage activities in ad research. This is not about imitation. It is about identifying the white space in a category where an ad can own a positioning nobody else has claimed.
The Meta Ad Library: start here, for free
The Meta Ad Library (library.facebook.com) provides free, publicly accessible visibility into every active ad running on Facebook and Instagram globally. Search by brand name to see their current creative, copy, and call-to-action. Filter by country (US or India), by ad type, and by activity status.
What to look for:
- Volume of ads running (high volume typically indicates that formats are performing)
- Consistency of messaging (what theme keeps appearing suggests it is working)
- Creative formats dominating (video vs. static, long-form vs. short-form)
- Landing page strategy (follow the ad through to the destination page, what is the conversion experience?)
Google Ads Transparency Centre
Google launched its Ads Transparency Centre to provide similar public visibility into search and display campaigns. Accessible at adstransparency.google.com, it allows searches by advertisers to view active campaigns across Search, Display and YouTube.
Semrush Advertising Research
For paid search intelligence, Semrush’s Advertising Research tool provides estimated monthly spend, keyword targets, ad copy variations, and competitive positioning. This data is useful for identifying which keywords competitors are actively investing in — a strong signal of where conversion intent is concentrated.
SpyFu
SpyFu specialises in competitive PPC intelligence, showing every keyword a competitor has ever bid on, their estimated monthly ad spend, and historical ad copy. The Kombat feature allows side-by-side keyword overlap comparison. It is useful for identifying terms where multiple competitors are investing (high-value) versus terms no competitor has claimed (opportunity).
Pattern analysis on what to document:
When analysing competitor ads, build a competitive creative matrix documenting: the primary message used, the emotional register (functional benefit vs. emotional story vs. social proof), the call-to-action type, the visual style, and the audience signals in the creative. After mapping four or five competitors, patterns emerge and so do gaps.
The gap is where the opportunity lives. If every competitor in a category is using rational, product-feature-led advertising, an emotional storytelling approach immediately differentiates. If everyone is targeting a broad mass audience, micro-targeted creative for a specific segment can achieve disproportionate recall.
5. Develop and test creative hypotheses
By Step 5, the research has produced an audience profile, qualitative consumer insight, and a competitive landscape map. The next step is translating all of that into creative hypotheses: testable assertions about what the ad should communicate and how.
A creative hypothesis follows a simple structure: “We believe [target audience] will respond most strongly to [message/creative approach] because [insight from research].”
Examples:
- “We believe millennial women in Tier 1 Indian cities will respond most strongly to authenticity-led storytelling that challenges beauty standards, because qualitative research surfaced strong fatigue with aspirational, unrealistic imagery.”
- “We believe US small business owners will respond most strongly to ROI-quantification messaging, because competitive analysis shows no competitor is speaking directly to business outcomes rather than product features.”
The creative development follows after and then ad testing. The systematic evaluation of whether the hypothesis holds under real consumer scrutiny.
What ad testing should measure:
Ad testing is not about asking consumers whether they like an ad. Likability is weakly correlated with actual advertising effectiveness. What matters is:
- Brand recall: Can the viewer attribute the ad to the correct brand 24 hours after exposure?
- Message comprehension: Does the viewer understand what the ad is communicating?
- Purchase intent: Does the ad move the needle on the viewer’s likelihood to consider, trial, or purchase?
- Emotional resonance: What emotional response does the ad trigger, and does that response align with the intended brand association?
- Distinctiveness: Does the ad cut through, or does it blend into the category noise?
Test design decisions that matter more than the question wording:
Presentation design. Monadic (matched cells, one execution each) gives the cleanest read but needs the largest sample. Sequential monadic (each respondent sees each execution in turn) is cheaper but flattens results when executions are similar, and later executions get less attention, so randomise order. Comparative (side by side, forced choice) is fast and decisive but measures preference rather than performance.
Variant count. Two to four. Every additional variant splits your sample into a smaller slice and raises the odds one looks like a winner purely by chance.
Never test the ad in isolation. Nobody watches one ad. They watch a break with five or six, or scroll past yours between two others. Testing your ad alone measures performance under conditions that will never occur, and it flatters every ad equally. Place the asset inside a realistic clutter reel, somewhere in the middle. An ad that performs alone and disappears in clutter is a common and expensive finding, and it is only visible if you design for it.
For the full breakdown of methodologies, test designs, and question sets, see What is Ad Testing and How to Do It.
6. Measure the right metrics and only the right metrics
The metrics that matter in ad research are the ones tied directly to the decision at the end of the process.
Pre-campaign metrics (research-stage):
- Concept preference scores (which concept scores highest on purchase intent)
- Comprehension rates (% of respondents correctly identifying the key message)
- Emotional response scores (positive vs. neutral vs. negative reaction by segment)
- Brand fit score (does the concept feel consistent with the brand?)
In-flight metrics (campaign-stage):
- Brand recall lift (measured via brand lift surveys, available natively in Meta and Google Ads)
- Message association (which claim consumers associate with the brand post-exposure)
- Frequency vs. impact curve (at what point does ad repetition stop generating returns)
Post-campaign metrics:
- Net brand sentiment shift
- Purchase intent movement (pre vs. post campaign, measured via survey)
- Unaided vs. aided brand awareness change
The split that determines your instrument. Some of these are claims and some are measurements, and mixing them up is the most common analysis error in ad research. Relevance, purchase intent, and brand lift are self-report by definition; asking is correct and nothing replaces it. Attention grab, attention hold, emotional resonance, and brand connection are measurements; asking produces a filtered, whole-ad average that hides where the problem is.
The most actionable finding in most studies is a conflict between the two categories. A strong survey brand-fit score on an ad with weak measured brand connection is not a contradiction: the ad is congruent with the brand, and nobody was watching when it said so.
Full breakdown, with benchmarks, in Advertising Research Metrics That Matter.
7. Choose the Right Tools
Free tools that every marketer should be using:
- Meta Ad Library — competitor creative intelligence, zero cost
- Google Ads Transparency Centre — competitor search and display intelligence
- Google Trends — real-time search demand data, invaluable for understanding seasonal messaging peaks in both the US and India
- Answer the Public / AlsoAsked — maps the questions audiences are actively asking in a category, directly informing ad messaging
- YouTube search — watching how competitors are using video advertising is free intelligence most brands overlook
Paid tools with high ROI:
- Semrush — full-suite competitive intelligence for paid and organic campaigns
- Ahrefs — particularly strong for content and creative performance benchmarking
- SpyFu — PPC-focused competitive intelligence
- Brandwatch / Sprinklr — social listening tools that surface organic consumer conversation about a category
Survey-based primary research tools:
- Merren WhatsApp surveys— 10x high response rates in the Indian market, where WhatsApp is the primary communication platform for a significant share of the population
- In-app survey tools — useful for gathering in-context feedback from existing users
Budget reality check:
Ad research costs vary enormously based on methodology, sample size, and geography. For a market-by-market breakdown of what different research methodologies cost, see How Much Does Advertising Research Cost.
Ad Research in India vs the US: Key Differences
Marketers operating across both markets need to account for structural differences in how ad research should be designed and executed in each context.
Language and linguistic complexity: The US is predominantly an English-language advertising market with regional accent and cultural variation that is manageable within a single research study. India is a 22-official-language market where a campaign designed for a Hindi-speaking audience in Uttar Pradesh can land entirely differently with a Tamil-speaking audience in Chennai. Research samples must reflect this diversity or conclusions will be misleading.
Platform behaviour: US digital advertising is dominated by Google Search, Meta (Facebook/Instagram), YouTube, and an increasingly significant Connected TV landscape. In India, WhatsApp is a primary discovery and sharing platform, Moj, ShareChat, and regional OTT platforms carry significant advertising weight in Tier 2 and Tier 3 markets, and Instagram Reels outperforms Facebook significantly among audiences under 30.
Trust and social proof: Research consistently shows that Indian consumers place higher weight on peer recommendation and expert endorsement than their US counterparts. Ad research in India should explicitly measure how well a creative concept leverages social proof elements, not just emotional resonance and message clarity.
Price sensitivity signalling: In the Indian market, ads that explicitly communicate value through price anchoring, comparison, or offer framing outperform pure brand-building creative across most FMCG and consumer electronics categories. This is less consistent in the US, where brand story and identity frequently outperform rational value propositions in premium and aspirational categories. Research design should test both approaches and not assume that US market findings translate to India without validation.
Mobile-first creative: India has one of the world’s highest mobile internet usage rates. Ad research in India must include mobile exposure testing. A creative that performs strongly on desktop or TV may score poorly when viewed on a 5-inch screen with a 3G connection. Format compatibility is a research input, not an afterthought.
Common Ad Research Mistakes (And How to Avoid Them)
Mistake 1: Testing too late in the creative process The most expensive place to discover that a concept does not work is after it has been produced. Research should be introduced at the concept stage. Rough storyboards, animatics, or even written descriptions of the creative idea and not after an expensive production has been completed.
Mistake 2: Asking the wrong questions Survey-based ad research frequently asks consumers whether they like an ad. Likability scores are notoriously poor predictors of ad effectiveness. The research questions that predict real-world performance measure recall, comprehension, intent, and emotional response.
Mistake 3: Using homogeneous samples A research sample made up entirely of existing brand customers will inflate positive scores. Effective ad research uses samples that reflect the target audience for the campaign which frequently includes people who currently have no relationship with the brand.
Mistake 4: Ignoring cultural context in cross-market research Direct translation of research instruments from English into regional Indian languages introduces measurement error. Concepts like “brand trust,” “value for money,” and “premium quality” carry different cultural loading in different markets. Research instruments must be culturally adapted, not simply translated.
Mistake 5: Treating ad research as a one-time event The brands with the strongest advertising track records treat research as a continuous loop. Testing, learning, iterating, and retesting rather than a project that has a start and an end. Each research cycle builds institutional knowledge that makes the next campaign faster and cheaper to optimise.
Run Ad Research with MIRA by Merren
The most significant barrier to rigorous ad research has historically been time and cost. Traditional pre-testing required recruiting respondents, conducting sessions, transcribing data, and producing analysis. MIRA by Merren solves this problem.
MIRA: the four questions that cannot be asked
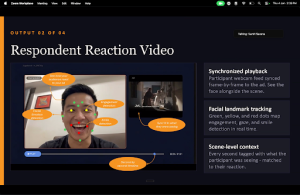
MIRA (Multi Input Response Agent for Ads) is Merren’s biology-based ad diagnostics product. It does not survey anyone. It measures what viewers’ brains and faces do while they watch, second by second.
Three signals fuse into one timeline:
Predicted neural response. An open-source brain-mapping model was built on roughly 1,000 hours of fMRI data. It produces on the order of 20,000 data points per second and predicts how a human brain would respond across every second of the ad. No respondents are needed for this layer. The read arrives in less than 40 minutes.
Gaze. Real target viewers watch the ad inside a clutter reel through their own webcams. The gaze is captured frame by frame. So every reaction is matched to the exact moment that caused it. Note the constraint from the India section: this layer needs a laptop or connected TV, not a phone.
Facial emotion. Seven emotion families, each scored 0 to 100 with timestamped peaks: delight, engagement, disengagement, friction, aesthetic appreciation, negative reaction, and surprise. This layer works on mobile.
Brand moments are detected automatically, both on-screen appearances and spoken mentions. So you can read the viewer’s exact state at the instant the brand lands.
What the output looks like. An engagement curve with peaks, troughs, and brand moments flagged on one timeline with diagnostics scored 0 to 100. Each score arrives with the evidence behind it and a specific action:
- Brand Connection, 27, weak. Brand visible in only 7% of frames, and not on peak moments. Action: move the brand to where the attention already is.
- Attention Hold, 41, weak. Engagement falls to near zero very early. Action: the problem is the premise, not the pacing. Viewers are leaving before the story establishes.
- Likability, 62, strong. Delight peaks mid-ad.
- Message Comprehension, 77, excellent. Friction is low; the narrative flows from setup to build to climax to resolution.
- Memorability, 80, excellent. Delight peaks align with brand visibility.
That is the difference between “people seemed to like it” and “your brand lands in a dead zone at second seven, move it to the delight peak at second nineteen.”
Where MIRA fits in the seven steps. Step 5, creative hypothesis testing, on any video asset from rough cut to final. It answers the four unaskable questions: did the opening earn attention, did attention survive the middle, what did viewers feel and in what state were they in when the brand appeared.
What MIRA does not do. It does not measure purchase intent, relevance, or brand lift. Those are claims and claims require asking. It does not benchmark your creative against a competitor’s on effectiveness unless both are run through the same test. It will not read a six-second bumper reliably, because assets under five seconds do not give a per-second model enough signal.
Maya AI: the questions that must be asked
Maya AI handles the self-report half: relevance, credibility, comprehension in the respondent’s own words, and intent.
Maya runs AI-moderated interviews from a researcher-approved discussion guide, executed consistently across every respondent, with adaptive probing when someone expresses confusion or strong emotion. Respondents participate via WhatsApp in their own environment, which produces more natural responses than a facility, and matters particularly in India where WhatsApp is the default channel. Analysis is automatic: themes clustered across the full sample, verbatims surfaced by theme, and a report structured around the research objective, available within hours of the last interview.
Ready to test your next ad before you spend media budget on it? Explore MIRA by Merren | Explore Maya AI | Request a pilot
Frequently Asked Questions About Ad Research
What is the difference between ad research and ad testing?
Ad research is the overall process of understanding how advertising should work before, during, and after a campaign. It includes audience research, competitor analysis, message development, and performance measurement.
Ad testing is one part of ad research. It focuses on evaluating ad concepts, creatives, or campaigns with a target audience to predict or measure their effectiveness.
How long does ad research take?
The timeline depends on the type of research.
- Competitive research can often be completed in 2 to 3 days.
- Qualitative studies such as interviews or focus groups usually take 2 to 4 weeks.
- Quantitative ad testing using AI-powered platforms such as MIRA can often be completed in 3 to 7 days.
Can ad research be done on a small budget?
Yes. Many businesses start with free tools such as Meta Ad Library, Google Trends, and Google Ads Transparency Center to understand competitors and audiences.
The amount you invest should match the size of your campaign. A business planning a $6,000 campaign does not need the same level of research as a national brand preparing a $6 million launch.
How is ad research different from market research?
Market research is the broader practice of understanding customers, competitors, industries, and market trends. Ad research is a specific type of market research that focuses on advertising effectiveness and creative development. In simple terms, all ad research is market research, but not all market research is related to advertising.
What sample size is needed for ad research?
For qualitative research, such as interviews or concept exploration, 8 to 15 participants per audience segment is often enough to identify key themes.
For quantitative ad testing, 150 to 300 respondents per audience segment generally provide reliable results for measuring metrics such as recall, purchase intent, and message comprehension. The ideal sample size depends on the level of accuracy required and the number of ads being tested.
Is ad research relevant for digital-only campaigns?
Yes. Digital campaigns can benefit greatly from ad research because it helps brands identify the strongest creative direction before spending media budget.
Research can reveal which messages, visuals, and concepts are most likely to perform well. It can also help marketers understand whether the intended message is reaching the audience during the campaign, making optimization more effective.