

Survey response bias can manifest in numerous ways. It impacts the data’s reliability and, consequently, the decisions made based on this data. Researchers need to identify these loop holes and take measures to correct them. After all, future strategies take a data-driven approach. In this blog we will discuss the common types of survey response bias, how it impacts data quality and steps to avoid them.
Common Types of Response Bias
Survey response bias occurs when the actual results are not tandem with the real experiences or feelings of your target audience. It is impossible to avoid bias but there are common ones to recognize. Here are the common types of response bias.
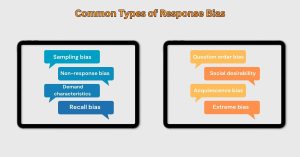
1. Sampling bias
Sampling bias happens when the sample of respondents do not accurately represent the population. This bias typically arises from non-random sampling techniques. The specific respondents skew the survey results such that the data is not-accurately applicable to the broader target population.
For example, surveying employees of the morning shift does not reflect the experiences of employees of the night shift. Removing the experiences of one section of the working population can be a problem. It may mean that the experience of the employees from the morning shift is also applicable to the people of the night shift.
2. Non-response bias
Non-response bias occurs when a significant number of the sampled population do not respond to the survey. This can skew the results if the non-respondents have different opinions or behaviours than those who did respond.
For example, people who are less tech savvy (senior citizens or busy populations) are less likely to respond to a survey. This can lead to an overrepresentation of millennials or gen-z who offer active participation for answering surveys.
3. Demand characteristics
Demand characteristic occurs when respondents try to guess the survey’s purpose and alter their answers accordingly. In this case, the answers lean towards satisfying the researcher than being truthful about actual experiences. This can occur in workplaces where employees will offer favourable responses in the hope of receiving incentives for perceived loyalty. They might refrain from offering genuine criticism.
4. Recall bias
Recall bias occurs when respondents do not accurately remember past events or experiences. This brings significant cognitive fatigue. To mitigate this event, switch to in-moment survey responses from Merren. When you launch post-purchase surveys, you can get fresh in-the-moment responses from people without any survey fatigue.
5. Question order bias
Survey questions can be placed in a way that can influence responses. This is called the question order bias.This can unintentionally lead respondents to answer subsequent questions based on the context set by earlier ones. For example, asking about job satisfaction right after questions on negative job aspects can lower satisfaction ratings due to the priming effect of the previous questions.
6. Social desirability bias
Social desirability bias occurs when respondents answer questions in a way they believe will be viewed favourably by others instead of offering true opinions.
7. Acquiescence bias
Acquiescence bias is a “yes-saying” or “no-saying,” bias. It occurs when respondents have a tendency to agree or disagree with all questions regardless of their actual opinions.
How to Identify Types of Response Bias?
A well-equipped customer experience tool can help you detect variations in answers across demographics and filters. This makes it easier to chalk out irrelevant data. You can compare data across channels and find out differences. Here are the 3 ways to detect inconsistencies with your market research campaigns.
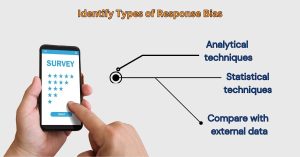
Analytical techniques:
Look for inconsistent answering patterns. People who exhibit acquiescence bias may end up agreeing to all statements without consideration (sometimes without reading the question). Assess the frequency and distribution of certain responses to reveal boas.For example, a high frequency of neutral responses might indicate neutral response bias.
Statistical test:
Marketers can detect extreme response bias by analysing the variance and distribution of response on a Likert scale. A CX analysis dashboard can reveal extreme or maximum neutral responses across most questions. This can denote potential biases.
Compare with external data:
Industry benchmarks can help detect potential biases in your campaigns. In a customer satisfaction survey, certain channels can display unusually high satisfaction ratings that do not align with other feedback channels (online response vs offline service). It might indicate the presence of social desirability bias. Discrepancies between the survey data and external data can indicate potential biases in the survey responses.
Tips to Avoid Various Types of Response Bias
1. Reduce sampling bias
- Use a random sampling method to ensure that every individual in the target population has an equal chance of being selected. Tools like random number generators can be used to pick participants randomly.
- Ensure that the sample demographics closely match the population you wish to study. This can be achieved by stratified sampling, where the population is divided into distinct subgroups or strata (such as age, gender, income level), and random samples are taken from each stratum.
- Survey tools like Merren offer demographic segregations where researchers can set quotas and monitor the demographic distribution of respondents.

2. Reduce non-response bias
- Personalized follow-up reminders can nudge participants to follow through the survey. With the help of Merren, you can craft reminders and schedule automated follow ups at touchpoints.
- Offer survey incentives for participants that are appropriate for the target audience. This can be in the form of a coupon code for next purchase, a freebie, loyalty points or a discount. Research shows that a coupon of as low as $10 can encourage participants.
- Simplify the survey process by opting for mobile-friendly platforms that people can access at any location. Use Merren to curate WhatsApp surveys, Facebook messenger surveys, chatbot pop ups and dynamic emails to get maximum response rate.
3. Reduce social desirability bias
- Clearly explain the participants upfront that the data collected will not be linked to them. Offer them confidentiality such that people offer honest answers. This is important for sensitive topics such as political views, cultural issues, health and wellness or medical history.
- Use indirect scenarios to obtain genuine answers. Techniques like the Randomized Response Technique (RRT) or via the use of vignettes, a hypothetical scenario can be described. Residents can react and respond to help you get more accurate yet personalized responses.
4. Avoid question order bias
- Randomizing questions can help reduce the influence of earlier questions on subsequent ones. Many survey tools offer question randomization without manual intervention. For example, in a consumer satisfaction survey, randomized questions on product features can prevent later responses from being influenced by earlier ones.
- Grouping questions on similar topics together can help reduce the impact of preceding questions on subsequent answers.
5. Avoid demand characteristic bias
- Explain the survey’s purpose and its importance for research and data-driven development. Allow people to understand that their response will be crucial for future research and improvements.
- People are more likely to respond when the feedback is accepted, reverted and valued. Assure them that there are no wrong or right answers.
6. Avoid recall bias
- Recall bias brings significant cognitive fatigue. To avert this, use in-the-moment feedback surveys automated at touchpoints. For example, post-purchase surveys can grasp shopping experiences immediately after a purchase. People can respond on-the-spot instead of waiting a few days.
- Seek specific details on certain events to avoid vague responses. For example, “How many times did you use our product in the last week?”. Provide time frames such that people can respond accurately.
7. Avoid acquiescence bias
- Leading questions can prompt respondents to agree or disagree regardless of their true feelings. Avoid leading questions and phrase it neutrally. Enable people to express experiences in their own words.
For example, instead of asking, “How satisfied are you with our excellent customer service?” a neutral question like “How would you rate your satisfaction with our customer service?” can be used. - Balancing positive and negative framed questions to counteract a tendency towards agreeable responses. Create questions with both positive and negative frames. This balanced approach encourages people to think critically about each statement rather than giving automatic agreement. For instance, a survey on workplace satisfaction might include statements like “I feel valued at work” (positive) and “I often feel undervalued at work” (negative). Respondents can reflect on both aspects.
Best Practices to Avert Survey Response Bias
Mitigating survey response bias involves implementing best practices in survey design and administration to minimize the factors that contribute to biased responses.
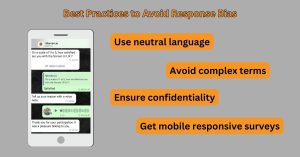
1. Use neutral language
Neutral survey questions are free of bias without leading or loaded language.
“Rate your satisfaction level with our customer support interaction” and add the appropriate rating scale. This will give you an accurate and quick response.
2. Avoid complex terms
The purpose of a questionnaire is to solicit genuine answers. Use simple words and avoid complex terms, abbreviations and acronyms. If abbreviations are required, explain it in advance. Keep the words simple across multilingual questionnaires.
3. Ensure confidentiality
Clearly communicate the measures taken to protect respondents’ privacy at the beginning of the survey. Assure people that their answers are anonymous and confidential to solicit genuine experiences. Alternatively, follow up and close the feedback loop to let people know that their experiences are valued for improvement. This will increase chances of you getting more responses in the future.
4. Add qualitative to quantitative
Varying the formats and contexts of survey questions can help mitigate biases. Use a mix of closed-ended questions, open-ended questions, and rating scales to capture more nuanced responses. For example, the Net Promoter Score scale must offer an open-ended question to let people express the reason for their rating.
5. Implement randomized question order
Randomizing the order of survey questions can help prevent respondents from falling into response patterns. This technique can reduce the likelihood of acquiescence bias that arises from predictable question order. Merren questionnaires offer an option which can automatically enable randomised questions without hassle.
6. Switch to mobile responsive platforms
People can be in a hurry to respond to every questionnaire when they feel inconvenienced. This is a massive obstacle when trying to collect genuine customer feedback. To enable people to answer hassle free, use applications that are popular. Merren empowers CX professionals to create WhatsApp forms, Facebook messenger surveys and interactive chatbots.

How Does Response Bias Affect Business?
Response bias can cause multiple problems for researchers. Here are the noteworthy issues.
Poor data quality: One cannot make reasonable inferences from skewed data. This includes extreme responses, inaccurate answers, less truthful responses etc. This data is usually scrapped as hours of research time goes to waste.
Stakeholder dissatisfaction: Stakeholders along with team members do not reach a good conclusion. This affects performance levels and marketing budgets in the future. This also affects collective team motivation.
Low return on investment: Hours of research work goes to waste. This denotes that teams have to regroup and create a campaign all over again to close the gaps. This is a massive waste of resources.
Delay on developments: Consumer data is required for continuous development. Misrepresentation of data can delay potential developments, product and service improvements.
Inconclusive research: Surveys might undergo a repeat campaign, or changes to identify if the data or the researchers are at fault. This takes time, money, and manpower.
Conclusion
Survey response bias is more common than we think. It can seep into the market research campaigns and render your data unreliable. Recognize patterns and sample your survey to a small number of participants. This helps you detect loopholes and improve on the final versions. If you want to obtain reliable and real time data, switch to Merren and view our AI capabilities. You can use this AI Survey Builder for an instant survey maker. To get started, sign up for a 14 day free trial here, no credit card required.