


Descriptive correlational research design is a non-experimental, quantitative method used to describe two or more variables as they naturally occur. It is used to measure the strength and direction of the relationship between them, without manipulating any of them. It is one of the most widely used designs in thesis and dissertation work. This lets researchers study real-world relationships ethically and practically.
This guide explains what the design is, how it differs from descriptive, correlational, and experimental research, how to conduct a study step by step, which correlation method to choose, and a full worked example you can model your own study on.
What Is Descriptive Correlational Research?
Descriptive correlational research describes variables as they exist in their natural setting and then measures how strongly and in what direction those variables are related. The researcher observes and records; they do not intervene, assign treatments, or control conditions. The name combines two ideas: the descriptive part captures the characteristics of the variables as they occur, and the correlational part quantifies the relationship between them using a correlation coefficient.
Methodologists describe this design as a study used to identify the nature, degree, and direction of the relationship between variables as they exist in their natural setting, without any attempt to establish cause and effect (Creswell, 2014; Polit & Beck, 2017).
The single most important caveat to hold onto from the start: a correlation reveals association, not causation. Two variables can move together for many reasons, including a third, unmeasured factor influencing both.
The design is most valuable when manipulation would be unethical or impractical. You cannot ethically force people to smoke to study lung health, or assign students fewer study hours to observe the effect on grades. Instead, you measure these variables as they naturally occur and describe how they relate.
What Is Descriptive Research?
Descriptive research aims to systematically and accurately describe a population, situation, or phenomenon. It answers “what” questions — what are the characteristics of this group, what behaviours occur, what is the current state of things — without exploring why they happen. Common methods include surveys, structured observation, and case studies. On its own, descriptive research produces a clear, factual snapshot that other research can build on.
What Is Correlational Research?
Correlational research measures the relationship between two or more variables without manipulating them. It answers questions about how variables are related and how well one can be predicted from another. Researchers quantify the relationship using a correlation coefficient, which expresses both strength and direction. There are three possible directions:
- Positive correlation — both variables move in the same direction (more study hours tend to go with higher grades).
- Negative correlation — one variable rises as the other falls (more screen time tends to go with less sleep).
- Zero correlation — no consistent relationship between the variables.
Correlational Studies: Key Components And Characteristics
Descriptive correlational studies focus on observation not intervention. It seeks to determine whether, and to what degree, a relationship exists between variables in real-world settings.
Types of variables in correlational studies
In most descriptive correlational studies, you will deal with two main types of variables:
- Independent variables (IV): These are the presumed cause or influencer in your research. They are not manipulated, just observed.
- Dependent variables (DV): These are the outcomes or results you are measuring in relation to the independent variables.
Clearly define both IV and DV for selecting the right statistical techniques and ensuring data validity.
Common data sources used for correlational studies
Correlational research draws from both primary and secondary data sources. These may include:
- Online surveys and mobile data collection
- Behavioral or transactional analytics
- Archived datasets and public databases
However, real-time data sources from WhatsApp or chatbot-based survey tools can significantly improve response rates. Implement to collect up-to-date insights from specific personas
Measurement scales in correlational research
Identifying the correct measurement scales impacts which correlation analysis you use:
- Nominal / ordinal scales: Best analyzed using Spearman’s rank correlation or Cramer’s V.
- Interval / ratio scales: Allows for more nuanced methods like Pearson’s correlation.
Tip: Use a measurement scale guide before collecting data to avoid mismatched analysis methods.
How to Design a Robust Descriptive Correlational Study
Creating an effective study starts with a clear purpose: You’re identifying patterns, not proving causality.
- Create a hypothesis: Example: job satisfaction is positively correlated with employee retention
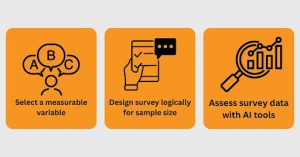
- Select a variable: Select your key variables and ensure each one is measurable through reliable and valid metrics
- Choose representative sample: Choose your population, a sampling strategy and survey them. Use Merren’s multichannel survey strategy. With Merren, you can reach broader and more diverse respondents via WhatsApp surveys, email surveys, and chat surveys. Maximize your response rate minus the friction.
- Design the survey logically: Use Likert or various rating scales, demographic checkboxes etc. The survey formats should gather numeric and categorical data that assist both descriptive and correlational analysis.
- Begin with descriptive analysis: Use mean, median, and standard deviation reveal initial patterns. This gives you a foundation to understand the data landscape before diving into relationships.
- Proceed to correlation analysis: Use Pearson’s r (for continuous variables), Spearman’s rho (for ordinal variables), or point-biserial correlation (for one continuous and one binary variable).
Creswell’s Framework for Descriptive Correlational Research
John W. Creswell, one of the most referenced scholars in research methodology, provides a structured framework for understanding and conducting descriptive correlational research. In his foundational text Research Design: Qualitative, Quantitative, and Mixed Methods Approaches, Creswell defines descriptive correlational design as a form of quantitative inquiry that aims to describe the degree to which two or more variables are related without any manipulation of those variables by the researcher.
What sets Creswell’s framework apart is its emphasis on naturally occurring relationships. Rather than constructing conditions to test a hypothesis, researchers using this design observe variables as they exist in real-world settings and measure the strength and direction of their association.
The three core phases in Creswell’s approach
Creswell outlines a clear sequence for conducting descriptive correlational research:
Phase 1 – Identify and Define Variables
Before collecting any data, researchers must clearly specify which variables they intend to study and how each will be measured. Creswell stresses that vague variable definitions lead to unreliable correlations. Each variable needs a concrete, measurable form. For example, “customer satisfaction” must be defined as a specific score on a validated scale, not a general impression.
Phase 2 – Collect Data Systematically
Creswell advocates for structured, consistent data collection methods like surveys, standardized instruments, or existing datasets. The goal is to gather numeric data from a representative sample large enough to detect meaningful relationships. He also emphasizes minimizing researcher interference during collection, so that observed relationships reflect reality rather than bias.
Phase 3 – Analyze and Interpret Relationships
Once data is collected, Creswell recommends using correlation coefficients. Most commonly Pearson’s r for continuous variables or Spearman’s rho for ordinal data to quantify the relationship between variables. Critically, he reminds researchers that a strong correlation does not imply causation. The role of the researcher is to describe the association accurately and acknowledge its limitations.
How creswell distinguishes descriptive correlational design from experimental design
A key contribution of Creswell’s framework is the clear boundary he draws between correlational and experimental research:
Descriptive Correlational Design | Experimental Design | |
Variable manipulation | None — variables observed as they are | Yes — researcher manipulates the independent variable |
Purpose | Describe and measure relationships | Establish cause and effect |
Setting | Natural, real-world environments | Controlled environments |
Ethical flexibility | High — suitable for sensitive topics | Lower — requires controlled conditions |
Typical output | Correlation coefficients, scatter plots | Statistical significance of treatment effects |
For CX researchers and business analysts, this distinction matters enormously. You cannot (and should not) deliberately lower customer satisfaction to test its effect on churn. Creswell’s descriptive correlational framework gives you a rigorous, ethical alternative: observe satisfaction and churn as they naturally occur, measure their relationship and use that insight to drive strategy.
Why Creswell’s framework remains the gold standard
Creswell’s approach has been widely adopted across disciplines from education and healthcare to social sciences and business research. It strikes the right balance between scientific rigor and practical applicability. His framework does not demand laboratory conditions or experimental controls. Instead, it equips researchers with a replicable, transparent process for uncovering patterns in real-world data.
For teams working in customer experience, market research, or organizational behavior, descriptive correlational research is one of the most accessible and actionable research designs available.
How to Collect Data Accurately in Descriptive Correlational Research
These best practices will help you gather accurate and actionable insights, especially in social and behavioral contexts where human responses can be nuanced.
1. Define variables clearly
Identify variables you aim to correlate. Clearly define how you will measure them, if it is through Likert rating scales, frequency counts, or open-ended responses. This removes ambiguity and brings consistency across your dataset.
2. Choose the right survey channels to reach respondents
Use multiple survey channels where people can offer responses without any bias.Collecting adequate data means meeting people where they are. Using multichannel strategies—like mobile messaging, email, or embedded chatbots—can significantly improve response rates and reduce sampling bias. A WhatsApp-native survey, for example, feels conversational and gets real-time input.
3. Pre-test your survey instruments
Ensure the following tests before publishing a survey: conduct pilot testing, check the clarity of questions, check if the response formats are appropriate. Pre-testing lets you identify confusing language or technical glitches that could skew responses and compromise your correlational analysis.
4. Avoid social desirability bias
Randomizing question order reduces priming effects. Preserving respondent anonymity improves honesty. Both practices help curb social desirability bias, which often taints behavioral data.
5. Monitor real-time data quality
Use tools with real-time dashboards to monitor response patterns. Watch for straight-lining, incomplete submissions, or unusually fast completions. These may indicate low-quality data unsuitable for correlation studies.
“Data quality is the foundation of correlational reliability. Without it, relationships between variables are merely assumptions, not evidence.”
Step-by-Step Method to Choose the Right Analytical Tools for Descriptive Correlational Studies
This section helps you decide which analysis to use and guides you step by step through the process of descriptive and correlational analysis.
Step 1: Start with descriptive statistics
Before diving into correlations, summarize your data using descriptive statistics. Mean, median, standard deviation and frequency plots reveal basic trends, patterns and outliers in your dataset. Descriptive stats form the foundation and help you validate data quality and guide your choice of correlation methods.
Step 2: Understand the nature of your variables
- If your variables are continuous and normally distributed, use Pearson’s correlation coefficient. It measures the strength and direction of linear relationships.
- If your data violates normality or includes ordinal variables, Spearman’s rank correlation is more appropriate. This non-parametric method ranks values before assessing their relationship.
Choosing the wrong method can skew results. For instance, Pearson can mislead if the relationship is non-linear. It might estimate a low correlation despite a strong curved pattern.
Step 3: use regression analysis for predictive insights
While correlations show association, regression methods tell you how much one variable predicts another. Simple linear regression works for one predictor and one outcome. For more complexity, like multiple influencing factors, use multiple regression. These tools not only reveal the strength of relationships but also quantify influence.
Quantitative analyses are only as good as the questions they answer. Always ask: Does this analysis match my hypothesis? Is the data sufficient in size and variance?
Interpreting Results and Understanding Correlation Strength
Once your survey responses begin rolling in, the first step is summarizing the data in a way that helps you understand what is happening. High-level summaries from frequency tables, mean scores, medians and percentages help you quickly spot trends, outliers, and respondent patterns. For example, if 78% of respondents rate your service 8 or above, that is a clear signal of strong satisfaction.
However, descriptive statistics only tell you what is happening, not why it is happening. That is where correlational analysis is needed. For instance, is there a link between satisfaction and repeat purchase intent? Or between customer service wait time and Net Promoter Scores? Understanding these correlations can guide where to focus improvements that will make the biggest impact.
When deciding which analysis to use, ask yourself: Am I trying to describe behavior or explain behavior? Use descriptive analysis when you need a snapshot. Use correlational analysis when you want to explore connections and make informed predictions.
Here is a simple step-by-step workflow:
- Start with descriptive statistics – Summarize every key metric. Use visualizations like bar charts or pie charts to quickly interpret patterns.
- Segment your data – Break results by demographics or responsive survey channels or product lines to spot differences.
- Identify hypotheses – Ask what relationships you are curious about. For example: “Are loyal customers more likely to respond to our customer feedback surveys?”
- Run correlation tests – Use pearson or spearman correlations depending on your data type. Look for coefficients above 0.3 or below -0.3 to signal moderate strength.
- Interpret results Thoughtfully – Correlation is not causation. However, strong correlations help you prioritize what to investigate deeper or act upon.
Getting these foundational interpretations right equips your team to listen strategically and act effectively.
Visualizing and Reporting Correlational Data
Effective visualization bridges the gap between numbers and decision-making. It helps stakeholders at every level see not just what is happening, but why.
Start with scatter plots:
Scatter plots show relationships between two variables. A tight cluster of points forming a clear line suggests a strong correlation, while scattered points may imply a weaker or no relationship. You can enhance these visuals by adding trend lines, confidence intervals, or even segmenting by demographic groups to surface deeper insights.
Use correlation matrices:
Matrices offer color-coded for readability, give at-a-glance understanding of the strength and direction of multiple relationships. Be sure to label axes clearly and include a legend if colors are used to represent coefficients.
Tailor reports by audience:
When creating reports, organize findings by key themes or audience needs.
- For executives, highlight business impact: how does variable A drive customer retention or revenue uplift?
- For researchers, provide details like p-values and sample size. Use narrative summaries to complement visuals and make statistical language accessible to non-technical stakeholders.
To decide which type of analysis and visualization is appropriate, ask yourself: What question are you trying to answer? If you are exploring natural relationships between variables without manipulating them, descriptive correlational research is the right fit.
Once you know that, move through the process: describe your variables, check assumptions (e.g., linearity, normal distribution), calculate correlation coefficients, and then plot or report accordingly.
Common Mistakes to Avoid
- Confusing correlation with causation. A strong relationship never proves one variable causes the other; watch for confounding factors.
- Using the wrong correlation method. Applying Pearson’s r to ordinal or non-linear data produces misleading results.
- Insufficient sample size. Small samples yield unstable coefficients.
- Sampling bias. A non-representative sample cannot be generalised; reach respondents across multiple channels to reduce this risk.
- Ignoring outliers. A single extreme value can inflate or deflate a coefficient — always inspect a scatter plot.
- Skipping a pilot test. Confusing questions or technical glitches create noisy data; pilot the instrument first.
Examples of Descriptive Correlational Research in Practice
Different industries use this method to draw meaningful associations between variables while keeping the focus on listening to people who matter.
Education: linking attendance and academic performance
Researchers often examine the correlation between student attendance and academic achievement. They identify patterns without altering variables. For example, high school administrators might analyze attendance data alongside final grades to assess whether students with higher attendance perform better academically. This type of research informs policy decisions without assuming causation, helping you understand patterns that warrant deeper investigation.
Healthcare: patient lifestyle and chronic illness management
Healthcare professionals explore relationships between patient behavior and disease outcomes. A hospital study may analyze the link between exercise frequency and recovery rates in cardiac patients. These analyses help you identify actionable insights for proactive care protocols without needing complex experimental designs. Such correlations can guide resource allocation and patient education strategies.
Social sciences: social media use and mental well-being
Researchers might explore how time spent on social media correlates with reported levels of anxiety or self-esteem. You can uncover how two naturally occurring variables relate within a population. Understanding these relationships enables more nuanced discussions about digital well-being without making causal assumptions.
Conclusion
Descriptive correlational research design offers a rigorous, ethical way to study how real-world variables relate without manipulating anything. By defining variables clearly, sampling well, choosing the right correlation method, and reporting results honestly, you can uncover meaningful patterns that guide further study and practical decisions.
When you are ready to gather the data for your own study, Merren lets you build surveys, distribute them across multiple channels, and track responses in real time. Start a free trial to collect clean, analysis-ready data for your descriptive correlational research.