
Net Promoter Score determines if your consumers are willing to recommend your products and services in a competitive landscape. In this blog we will learn the key takeaways of how to calculate Net Promoter Score and how you can improve the customer experience (CX) with this evaluation.
How Does Net Promoter Score Work?
The Net Promoter Score (NPS) is a customer feedback metric used to measure brand recommendation, brand loyalty and customer satisfaction. It segments customers based on a single yet straightforward question:
“How likely are you to recommend our product/service to a friend or colleague?”
The respondents provide a score on a scale of 0 to 10, with 0 being highly unlikely and 10 being extremely likely.
The customers are categorized as promoters, passives, and detractors.
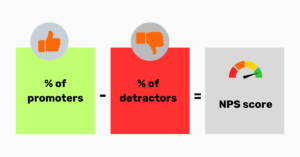
Formula to Calculate Net Promoter Score:
To measure NPS score, calculate percentage of promoters and percentages of detractors. NPS= % of promoters – % of detractors.
Keep in mind the following pointers:
- Avoid the passives. They are not included in the NPS calculation. Passives represent neutral feedback and do not affect the loyalty metrics.
- The actual calculation depends on detractor and promoters. Identify them and add them in the formula.
- Find the percentage of promoters and detractors. Divide the number of promoters and detractors by the total responses. Then multiply by 100.
- Subtract the percentage of detractors from the percentage of promoters. This result is your NPS
For example: if you receive 100 responses in your NPS survey, here is the breakdown:
- 70 are promoters
- 20 are passives
- 10 are detractors
Subtract 10 from 70 to get 60. Your NPS score is 60. If your survey size increases, you can use the Merren NPS calculator here.
Interpret the Net Promoter Scale
Respondents are categorized based on the response to this core question. Here is the segmentation.
Promoter (9 or 10)
Promoters are loyal customers or enthusiastic buyers of your brand. They make the first purchase when a brand launches new merchandise (brands like Apple can boast of high NPS scores, courtesy their promoters). Promoters account for 80% of referrals in most businesses. The employees might also find them the most pleasant to deal with.
Understand their issues and capture it at pain points to elevate their customer experience.
Detractor (0-6)
Detractors are unhappy customers who can account for the maximum negative word of mouth. This can also discourage new customers from making their first purchases and demotivate employees.
Focus on resolving customer issues and address their concern at the earliest. With proper processes and closing the feedback loop, you can convert detractors into promoters.
Passive (7 or 8)
Passives neither swing to either side of the scale. They are satisfied for the time being. There is a probability for them to be detractors or promoters based off of the entire customer experience. Their referral rates are 50% lower than those of promoters. They are not brand advocates since they may switch to the competitor’s side.
Focus on positive customer onboarding for passives and provide enhanced customer experiences to maintain engagement.
Calculate Net Promoter Score
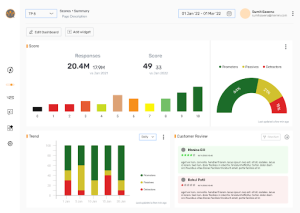
- Use Merren’s NPS software to create NPS surveys. Our CX dashboard will showcase the results automatically without any manual hassle.
- You can use this excel sheet here to calculate Net Promoter Score.
- You can also opt for other online tools that can calculate Net Promoter Score at your finger tips.
Why Should You Calculate Net Promoter Score?
Understand who your audience are and how you can serve them best. This quantitative data is more than just a scale. Here’s why you should calculate NPS:
Benefits of NPS calculation
Understanding customer experience: NPS calculation provides insights into customer satisfaction levels, enabling organizations to map and improve the overall customer journey.
Gauging customer loyalty: NPS calculation aids in identifying loyal customers who can advocate for the brand.
Informed business decisions: By calculating NPS, businesses can make data-driven decisions based on customer feedback. This can help you focus on product improvement, customer services and overall customer experience.
Benchmarking customer satisfaction: NPS calculation allows organizations to compare their scores against industry benchmarks. Get insights into their brand’s performance and highlighting areas for improvement.
NPS benchmarks: By monitoring NPS, organizations can establish benchmarks within their industry, define target Net Promoter Scores, and work towards achieving them.
What’s a good Net Promoter Score?
A good Net Promoter Score in 2025 varies as per industry, product and service offerings, company size and market context. Here are the main key points to consider.
- Global benchmark: The global average benchmark is +32, while the median is +44.
- Performance measures: Brands that have lower performance score 0 or lower. Companies that have the highest performance score 72 or above.
- Industry-specific benchmarks: Technology companies have an average NPS of 35 with higher performing brands scoring 64 or higher. For consumer goods and services, the average NPS is 43, with higher performing brands scoring 72 or higher.
- Peer-to-peer competition: Each industry has their own norms. Certain industries can be tough to break into depending on intense competition. Measure your NPS performance using Merren’s omnichannel tool. Merren can showcase data and help you determine your stance in the market.
- Market context:
- The level of customer experience can be different for luxury oriented industry vis-a-vis industries that target a larger consumer base. Retail industries can be rated lower than the CX in the technological industry.
- If your score is on the higher side than your competitors, it means that you are doing considerably well. If your score is below average, there are gaps that you need to address.

8 NPS Calculation Mistakes to Avoid
Calculating the Net Promoter Score (NPS) seems straightforward, but common errors can lead to misleading results. Below, we outline common mistakes, their impact, and real-world examples.
1. Incorrect respondent classification
Mistake:
Misclassifying respondents’ scores leads to faulty calculations. For instance:
- Assigning scores of 7 or 8 (Passives) as Promoters.
- Failing to include Detractors (0–6 scores) in the formula.
Impact:
Overestimates loyalty and hides dissatisfaction.
Example Scenario:
A retail chain misclassified Passives as Promoters. When they compared their NPS to competitors, they discovered their actual score was 20 points lower, revealing a significant loyalty gap.
Solution:
Double-check that Promoters (9-10), Passives (7-8), and Detractors (0-6) are classified correctly before calculating.
2. Sampling bias
Mistake:
Surveying only a specific customer segment, such as recent purchasers or high-value clients for biased results.
Impact:
The NPS reflects only the views of a subset, ignoring a broader audience that may include detractors.
Example Scenario:
A SaaS company surveyed only its most active users. Their NPS showed a strong +65. When they expanded the survey to less engaged users the score dropped to +25, revealing major usability issues.
Solution:
Ensure your survey reaches a diverse and representative sample of your customer base, including recent, lapsed, and long-term customers.
3. Lack of follow-up questions
Mistake:
Relying solely on the NPS score without understanding the “why” behind customer ratings.
Impact:
Missed opportunities to address issues or leverage strengths.
Example Scenario:
An e-commerce company received a -10 NPS but didn’t include follow-up questions. After adding an open-ended question asking, “What influenced your rating?” they discovered recurring complaints about delayed shipping. Addressing this issue improved their score to +20.
Solution:
Always include follow-up questions like “What’s the main reason for your score?”. For the detractor, ask “How can we improve your experience?”
4. Survey timing errors
Mistake:
Certain products that require high investment need time for the consumers to fully experience the product before they can form an opinion.
Impact:
Customers may respond prematurely, leading to inaccurate or irrelevant feedback.
Example: Consumers using technological products such as a phone need ample time to assess their experience. They can share a first use experience vs later use experience. Certain products can have consistent performance or can show up with defects in the immediate future.
Solution:
Time surveys to capture feedback after customers have had sufficient time to evaluate their experience, such as 7–14 days post-purchase or service interaction.
5. Too frequent surveys
Mistake:
Surveying customers too often can lead to survey fatigue and reducing response rates.
Impact:
Annoyed customers may give lower scores or ignore future surveys entirely.
Example Scenario:
A telecom company sent NPS surveys monthly to the same customer base. Scores declined, not because of poor service, but due to customer frustration with frequent surveys.
Solution:
Establish a reasonable survey frequency, such as quarterly or semi-annually, based on your industry and customer interaction frequency.
6. Not accounting for cultural differences
Mistake:
Assuming global customers score the same way, without accounting for cultural nuances in survey responses.
Impact:
Scores may appear lower or higher due to cultural biases in rating.
Example Scenario:
A global fashion retailer found that Asian customers tended to avoid giving extreme scores (9-10), even if satisfied. As a result, their NPS in Asia lagged behind Europe and North America.
Solution:
Use region-specific benchmarks to interpret results accurately.
7. Misinterpreting passives
Mistake:
Overlooking Passives (scores 7-8) as unimportant since they do not directly affect the NPS calculation.
Impact:
Missed opportunities to convert Passives into Promoters.
Solution:
Analyze Passive feedback separately and take targeted actions to improve their experience.
8. Using NPS as the only metric
Mistake:
Relying exclusively on NPS without considering complementary metrics like CSAT (Customer Satisfaction Score) or CES (Customer Effort Score).
Impact:
NPS doesn’t provide a complete picture of customer experience.
Example Scenario:
A ride-hailing company with a high NPS (+70) overlooked its low CES score, which indicated customers were struggling with app navigation. The issue led to dissatisfaction and churn despite the high NPS.
Solution:
Use NPS alongside other metrics to get a holistic view of customer experience.
Conclusion
Designing an NPS questionnaire does not need much technical details since it is merely 2 questions long curated carefully and precisely. These questionnaires can gauge the overall customer experience and identify potential gaps to close them. It is one of the most effective ways to identify potential brand advocates and attend to detractors to close the feedback loop. Sign up for a 14 day free trial with Merren and get started with your own CX metrics.