
Qualitative data analysis is the process of interpreting non-numerical data such as open-ended survey responses, interviews, focus group discussions, and customer feedback to uncover patterns, themes, and insights. Unlike quantitative data, which focuses on numbers and measurable outcomes, qualitative data explains the why behind customer behaviors and decisions.
In this blog, you’ll learn how to analyze qualitative data using a structured process, proven methods, and modern tools.
Why Analyze Qualitative Data?
Analyzing qualitative data provides deeper insights that numbers alone cannot. While quantitative analysis might show you what is happening (e.g., declining sales), qualitative analysis reveals why (e.g., negative product experiences). Businesses, researchers, and CX professionals use it to:
- Understand customer emotions – identify satisfaction, frustration, and expectations.
- Improve decision-making – by grounding strategies in real human perspectives.
- Generate hypotheses – that can later be tested quantitatively.
- Enhance customer experience (CX) – uncovering friction points in the journey
Qualitative data analysis methods
Several well-established methods help you analyze qualitative data effectively:
- Thematic analysis – Identify and interpret themes and patterns in data. Flexible and widely used in research and business.
- Content analysis – Systematically code and quantify words, phrases, or themes to measure frequency.
- Narrative analysis– Explore the stories and personal accounts behind the data.
- Discourse analysis – Focus on language use, context, and communication patterns.
- Grounded theory – Develop theories based on data collected, rather than starting with a hypothesis.
How to Analyze Qualitative Data: 8 Key Steps
1. Data collection and preparation
Why do you need it:
Effective qualitative analysis starts with well-prepared data.
Method:
To start the analysis process, ensure that you have collected data that’s complete and ready for analysis. Here’s how:
- Review all collected data for completeness: Ensure that there are no gaps in your data set. Verify that all survey responses are collected and there are no missing entries. Missing entries could impair the analysis.
- Transcribe audio recordings if applicable: If your qualitative data includes audio recordings or voice notes from WhatsApp surveys, use a speech to text analysis. This will convert verbal data into a text format.
- Clean the text to remove incomplete responses: Before diving into the actual analysis, clean your dataset. Remove any irrelevant information, such as metadata, system messages, or incomplete responses that don’t add value to your research objectives.
2. Understand the data
Why do you need it:
Understand the data thoroughly to analyze the survey responses.
Method:
Once data preparation is complete, become deeply familiar with the data you’ve collected. Here’s a step-by-step guide:
- Read through all the responses multiple times: Engage with the data by reading through all responses multiple times. This process allows you to get a sense of the overall trends and nuances within the data.
- Make notes on initial impressions and recurring themes: During your reading, jot down any initial impressions and notable themes that emerge. This helps in forming the basis for your coding and thematic analysis stages.
This adaptation phase is critical because it provides a broad overview and helps you become intimately acquainted with your dataset. Understand the context and respondent sentiment. This is key for effective subsequent coding.
3. Categorize into meaningful groups
Why do you need it:
Initial coding serves to break down the qualitative data into manageable pieces. This coding can be done manually for smaller datasets. For larger datasets, you can rely on BI tools and coding softwares.
Method:
This step-by-step approach outlines how to do this:
- Identify data relevant to your research question: Filter through your data that pertain to your research objectives. For example, if you’re researching customer satisfaction, focus on responses that directly relate to customer experiences and feedback.
- Assign preliminary codes to these segments: Develop a coding scheme by assigning preliminary codes to each data segment. These codes could be as simple as single words or short phrases like ‘customer satisfaction’, ‘product feature complaints’, or ‘service experience’. Tag pieces of text with labels that represent their meaning.

4. Organize data to make it easy
Why do you need it:
Organized data is easier to analyze and interpret.
Method:
Organizing your coded data is an essential step. It paves the way for deeper analysis and clearer interpretation. Here’s how to do it effectively:
- Group similar codes together to form categories: After initial coding, the next step is to cluster similar codes into broader categories. For instance, if your codes include ‘positive feedback’, ‘negative feedback’, and ‘neutral feedback’, you could categorize these under ‘customer feedback’.
- Use spreadsheets or qualitative analysis software to manage categories: Use tools like Excel spreadsheets or qualitative analysis software to keep track of your categories efficiently. Spreadsheets can help you visually sort and filter data. Specialized software offers more sophisticated management and retrieval systems for qualitative data.
5. Identify underlying theme
Why do you need it:
Themes represent the underlying patterns and insights in the data.
Method:
Identifying themes is a central part of the process when learning how to analyze qualitative data surveys. Here is a structured approach:
- Review the categories and identify broader themes: Revisit the categories and look for connections and overarching patterns. For instance, the categories ‘customer satisfaction’ and ‘product complaints’ may both fall under a broader theme of ‘product quality’.
- Consolidate similar themes to refine your analysis: Any overlapping or similar themes should be consolidated for a more streamlined and coherent analysis. This step refines your coding framework to get a clearer understanding of key insights in the data.
- Consolidate similar themes to refine your analysis: Any overlapping or similar themes should be consolidated for a more streamlined and coherent analysis. This step refines your coding framework to get a clearer understanding of key insights in the data.
6. Visualize data on a chart
Why do you need it:
Visual representation of qualitative data helps in better interpretation and presentation.
Method:
Transforming qualitative data into visual formats is an educational and practical way to analyze qualitative data surveys. This process involves the following steps:
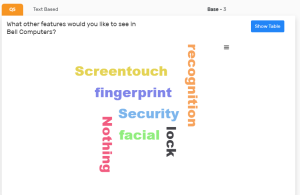
- Use word clouds to highlight frequent terms: Word clouds provide a quick visual representation of the most frequently appearing terms in your responses. Platforms like Merren CX can generate word clouds that make key terms stand out at a glance.
- Use charts to show relationships between themes: Visual aids, such as thematic maps or relationship charts, help in illustrating the connections between identified themes. Use Merren’s AI analysis to generate quick insights on your dashboard..
7. Interpreting the data
Why do you need it:
Interpretation converts raw data into meaningful insights.
Method:
Here’s a step-by-step approach:
- Relate the identified themes back to your research questions: Each identified theme should be evaluated in the context of your research questions. This step ensures that your analysis is focused and relevant.
- Consider the context behind the themes and categories: Delve into the context to understand the nuances behind each theme. For example, a theme of ‘customer dissatisfaction’ might have deeper sub-themes like ‘poor customer service’ or ‘high product pricing’. Contextual interpretation helps to offer more nuanced insights.
8. Reporting the findings
Why:
Presenting your findings effectively is essential for informed decision-making.
How to:
To effectively analyze qualitative data surveys, the final step is to report your findings. Here’s how:
- Summarize key themes and insights: Offer a concise summary of the main themes and insights. This should summarize the core findings from the qualitative data. Stakeholders can extract valuable information quickly.
- Use quotes from respondents to support your findings: To add depth to your report, include direct quotes from respondents. These quotes act as evidence that support your conclusions.
- Include visual aids like charts and graphs: Visual aids are instrumental in conveying qualitative findings. Use thematic maps, word clouds, or charts to highlight key points.
AI-Powered Qualitative Data Analysis
Artificial intelligence is transforming how we analyze qualitative data. Tools powered by NLP (Natural Language Processing) and machine learning can automatically code responses, detect sentiment, and surface hidden themes. While AI doesn’t replace human interpretation, it can accelerate the process and reduce manual effort.
Conclusion
Use this guided 8-step process to analyze vivid qualitative data. Draw real world conclusions and derive actionable insights from the reports. You can obtain open-ended responses from customer satisfaction surveys or a specific product/ service feedback. These responses are often vivid and need more considerations during analysis. Relate the findings to business objectives or customer experience improvement strategies. This connection ensures that your qualitative analysis has practical, real-world applications. To collect super fast qualitative insights, sign up for a 14 day free trial with Merren CX.