The semantic differential scale can gauge various aspects of an experience. Unlike standard satisfaction questions, this scale captures the emotional nuance behind a customer’s opinion.
Whether you are launching a new product, measuring brand perception, or conducting an employee engagement survey, this guide will cover everything you need to know about the semantic differential scale and how to use it for comparative feedback.
What is a Semantic Differential Scale?
A semantic differential scale asks respondents to rate a subject (like a brand, product, or service) between two opposite adjectives (bipolar adjectives).
Developed by psychologist Charles E. Osgood in 1950, this method allows researchers to quantify subjective attitudes. You present the survey respondents with a spectrum of opposing traits, such as “Reliable” vs. “Unreliable” or “Modern” vs. “Outdated.”
The scale’s strength lies in its ability to capture multidimensional aspects of meaning, often categorized into three core dimensions identified by Osgood’s research:
- Evaluation: Measures good vs. bad aspects (e.g., pleasant-unpleasant, fair-unfair).
- Potency: Assesses strength or intensity (e.g., strong-weak, powerful-powerless).
- Activity: Gauges energy or dynamism (e.g., active-passive, exciting-boring).
The scale is a 5-point rating scale or a 7-point rating scale:
- Point 1 (Left extreme): Very closely related to the left adjective.
- Point 4 (Neutral): Neither/Mixed feelings.
- Point 7 (Right extreme): Very closely related to the right adjective.
Example:
Customer effort score surveys (CES) uses semantic differential scale. The scale captures the emotional and effort of customers toward using a product, service or ease of an interaction.
Example: “How easy was it to resolve your issue with our support team?”
Difficult: 1, 2, 3, 4, 5: Very Easy
How Does Semantic Differential Scale Work?
A semantic differential scale creates a bipolar continuum where respondents position their views. Here’s a step-by-step breakdown:
- Select bipolar adjectives: Choose pairs that are true opposites and relevant to your topic. Ensure they cover key dimensions like evaluation, potency, and activity.
- Define the scale: Use an odd-numbered scale (e.g 5 or 7 points) for a neutral midpoint, or even-numbered (e.g 6 or 10) to force a lean. Label endpoints clearly, with numbers or blanks in between.
- Present the question: Group multiple pairs under a single prompt, like “Rate our new app on the following attributes.”
- Collect responses: Respondents select a point on each scale, generating quantitative scores.
- Analyze data: Calculate means, variances, and correlations to identify patterns. Tools like factor analysis can reveal underlying dimensions.
Structure and format tips
- Scale Length: A 7 point scale is common for balance between simplicity and granularity.
- Visual Design: In digital surveys, use sliders or radio buttons for ease. Avoid clutter by limiting to 5-10 pairs per question.
- Instructions: Keep them clear, e.g., “Mark the point that best represents your view.”

Semantic Differential Scale: Examples and Question Types
Semantic differential scales fully examine its real-life applications. Here are tangible examples to highlight how these scales are used in various surveys.
1. Brand perception
Measure how consumers view your brand’s image.
Example Prompt: “How do you perceive Brand X?”
- Reliable | Unreliable
- Modern | Outdated
- Innovative | Traditional
2. Customer satisfaction
Measure customer satisfaction (mainly customer effort score scale) using the semantic differential scale. It captures a spectrum of emotional metrics and attitudes towards a product /service/ experience.
Gauge ease of interaction. Example: “Rate your recent support experience.”
- Easy | Difficult
- Efficient | Inefficient
- Helpful | Unhelpful
3. Product attributes
Assessing specific product attributes is also a frequent use case: Example: “Assess our new smartphone.”
- Durable | Fragile
- Affordable | Expensive
- Comfortable | Uncomfortable
4. Employee feedback
In organizationals, semantic differential scales can evaluate employee satisfaction and workplace dynamics: Example: “Rate your team environment.”
- Motivating | Demotivating
- Collaborative | Isolated
- Inclusive | Exclusive
5. UX research
Capture how users interact with the interface. Example: “Evaluate our website navigation.”
- Intuitive | Confusing
- Engaging | Boring
- Fast | Slow
How to Analyze Semantic Differential Scale Data
- Calculate averages: Find mean scores per pair to spot trends (e.g., high “innovative” ratings).
- Examine variance: High dispersion indicates divided opinions.
- Factor analysis: Group pairs into Osgood’s dimensions for deeper profiles.
- Compare segments: Break down by demographics using tools like Merren’s filters.
- Visualize results: Create charts (e.g., spider diagrams) for semantic profiles.
- Track over time: Monitor changes in longitudinal studies.

Semantic Differential Scale: Advantages
Semantic differential scales are popular among survey designers for good reasons. Here’s why they’re useful:
1. Get more precise answers
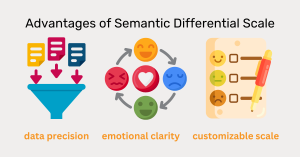
The primary advantage is the precision in data collection. This scale helps people express their opinions in a more detailed way. It captures subtle differences in how they feel (sentiment analysis).
2. Greater data for better analysis
Respondents rate their attitudes on a detailed scale. This data is richer than a simple yes/no response. This helps you do a deeper analysis and make better-informed decisions.
3. Versatile use of scale
This flexible scale can be used in many areas such as psychology, market research, or customer feedback. It adapts well to different survey goals.
4. Captures emotions and thoughts clearly
This scale does a great job of providing a clearer picture of how respondents feel and think about an experience or product. It can be hard to measure with other types of questions.
5. Minimal response bias
Compared to simple dichotomous scales (agree/disagree or true/false rating), semantic differential scales can reduce response biases. When people have a more intricate rating system, people are less likely to give the “safe” or socially expected answer.
6. Easy to compare results
The semantic differential scale also facilitates comparative analysis. Using the same scale over time or across different surveys helps you compare results and track changes in opinions easily.
Semantic Differential Scale vs Likert Scale: Which is Better?
While both semantic differential and Likert scales are tools for measuring attitudes, each offers unique strengths and weaknesses. Understanding these differences can help you choose the appropriate scale for your survey needs.
1. Purpose of measurement
- Use a Likert scale if your goal is to measure agreement or disagreement with specific statements.
- Choose a semantic differential scale if you want to gauge opinions between two contrasting ideas or attributes, offering a spectrum of responses.
2. Audience considerations
- Likert scales are easier to understand but may lead to response biases. Such as: acquiescence bias (agreeing too easily), social desirability bias (providing favorable answers).
- Semantic differential scales require more mental effort as participants interpret abstract concepts on opposite ends of a spectrum.
3. Question framing
- If a question cannot be framed using opposing adjectives, a Likert scale might be a practical choice.
- For questions where direct statements might influence responses, semantic differential scales offer a more subtle approach.
4. Ease of use
- Likert scales are often seen as versatile and simpler for most contexts.
- Semantic differential scales may be better for uncovering nuanced insights, but they demand more from participants.
Pro Tip:
To minimize response biases in Likert scales, Merren can streamline the process and enhance the reliability of feedback. Make an informed choice that aligns with your research objectives and audience needs.
Aspect | Semantic differential scale | Likert Scale |
Format | Bipolar adjectives on a continuum (e.g: good-bad). | Agreement with statements (e.g: strongly agree-disagree). |
Best used for | Measuring emotional attitude, brand perception and “feel.” | Measuring agreement with specific facts/opinions. |
Pros | Reduces bias, captures multidimensional views. | Simpler, faster to answer and analyze. |
Cons | Extreme Response Bias (People might pick ends of the scale). | Prone to central tendency and acquiescence bias (People tend to agree). |
Best for | Nuanced emotional insights (brand perception). | Straightforward opinions (satisfaction surveys). |
Best Practices for Using Semantic Differential Scales
Implementing semantic differential scales effectively requires adherence to best practices.
Clear instructions
Customize the pairs of opposite adjectives to match the specific topic or context of your survey. Adjectives should be directly relevant to draw out useful, meaningful answers from respondents. To get this right, try running pre-tests on a small group to refine and improve your adjective choices before finalizing them.
Tailored adjectives
Customizing the bipolar adjective scale to fit the specific context of your survey is crucial. This tailoring ensures the adjectives are relevant and capable of eliciting meaningful responses. Pre-tests can help refine your adjective pairs.
Consistent scale
Maintain consistency in the scale’s length and midpoint across survey questions. This is important to avoid confusing respondents. Use a uniform scale range (e.g.,1 to 7) throughout the survey to facilitate easy comprehension and comparison.
Cultural sensitivity
If your survey targets a diverse audience, consider cultural differences that may affect how adjective pairs are interpreted. Adapting your scale to be culturally sensitive can improve the accuracy and relevance of the data.
Use of technology
Leveraging survey software that supports semantic differential scales can streamline the implementation process. These tools often come with built-in templates and analytical features that simplify data collection and analysis.
Data analysis plan
Before deploying your survey, develop a clear plan for analyzing the data. Determine the statistical methods you will use to interpret the responses and the insights you aim to extract.
Regular review
Regularly review and update the differential scales to ensure they remain relevant and effective. This is especially important in rapidly changing fields like technology or consumer products.
Training
If you have a team responsible for survey creation and analysis, train them well to understand the use of semantic differential scales. This includes understanding how to design, implement, and analyze these scales correctly.
How to Create A Semantic Differential Scale with Merren?
Merren is an AI-powered customer feedback platform that makes it easy to deploy these advanced scales via the channels your customers actually use like WhatsApp, Facebook Messenger, and Email.
- Select a template: Choose from over 200 templates or let our AI build a survey for you.
- Customize your scale: Add your bipolar adjectives (e.g., “Fast” vs “Slow”).
- Distribute: Send the survey link directly to your customers’ mobile phones.
- Analyze: Use the Merren CX dashboard to instantly visualize the data and spot the gaps between your brand and the competition.
Sign up today to transform your feedback into growth. For more on related tools, check our guide on various rating scales.

