
You resolve a customer’s issue. They’re satisfied. But do they stay loyal? Not necessarily, not if getting to that resolution felt like running an obstacle course.
That’s the insight that changed how leading brands think about customer experience. It’s about how easy you make it for customers to solve them. That’s exactly what Customer Effort Score (CES) measures.
In this complete guide, you’ll find everything you need: the CES definition, how to calculate it, industry benchmarks, survey question examples, and a step-by-step strategy to improve your score and your retention rates.
📌 What You’ll Learn in This Guide:
- What is Customer Effort Score (CES) and where it came from
- How to calculate CES with a simple formula + worked example
- Customer effort score benchmarks by industry (2025)
- What is a good effort score and how to interpret your results
- CES vs NPS vs CSAT: which metric should you use?
- 7 proven strategies to improve your CES with Merren
What is Customer Effort Score (CES)?
Customer Effort Score (CES) is a customer experience (CX) metric that measures how easy or difficult it was for a customer to complete a specific interaction with your business. It could be resolving a support issue, making a purchase, navigating a self-service portal, or completing onboarding.
CES asks something more predictive: “How easy was it?”. That difference matters enormously.
💡 The Classic CES Survey Statement:
“[Company] made it easy for me to handle my issue.”
Customers respond on a scale from 1 (Strongly Disagree) to 7 (Strongly Agree).
The origin of CES: a Harvard business review breakthrough
CES was introduced in 2010 by the Corporate Executive Board (CEB Global, now part of Gartner) in a landmark Harvard Business Review article titled “Stop Trying to Delight Your Customers.” The research team challenged the prevailing assumption that exceeding customer expectations was the key to loyalty.
Their finding was counterintuitive: reducing customer effort was a stronger predictor of loyalty than delighting customers. Customers don’t necessarily become loyal when you wow them but they almost certainly become disloyal when you make things hard.
94%
of low-effort customers intend to repurchase
96%
of high-effort customers become more disloyal (Gartner)
40%
more accurate than CSAT at predicting loyalty
Customer effort score meaning: what does it really capture?
The customer effort score meaning goes beyond a simple rating. CES captures the perceived ease of any interaction across the customer journey from first contact to post-purchase support. It signals:
- Friction in your processes (too many steps, confusing interfaces)
- Inefficiency in your support (transfers, repeat contacts, long resolution times)
- Self-service gaps (customers can’t find answers without calling in)
- Churn risk high effort is one of the strongest early warning signs
When customers find it easy to do business with you, they return. When they don’t, they leave and they tell others. According to CEB research, 81% of customers who had high-effort experiences planned to share negative word of mouth.
How to Calculate Customer Effort Score?
Calculating CES is refreshingly simple. Here’s the Customer Effort Score calculator formula:

Example
Let’s say you send a CES survey after 200 support interactions. The total sum of all scores is 980.
CES = 980 ÷ 200 = 4.9 out of 7
On a 7-point scale, a score of 4.9 is a solid result (customers are finding interactions relatively easy).
CES survey scale options
5-Point Scale:“How much effort did you personally have to put forth to handle your request?” (1 = Very Low Effort → 5 = Very High Effort). Lower is better on this framing.
7-Point Likert Scale: The most widely used. Customers rate agreement with “[Company] made it easy for me to handle my issue.” (1 = Strongly Disagree → 7 = Strongly Agree). Higher is better.
Emoji / Visual Scale: Simple smiley/neutral/frowny face options. Best for mobile-first or quick micro-surveys.
⚠️ Important Wording Note:
When asking about “effort,” a lower score is better. When asking about “ease,” a higher score is better. Always be consistent with your phrasing to make your trends meaningful.
When to Use CES: The Right Touchpoints for Customer Effort Surveys
CES is most powerful as a transactional metric deployed immediately after a specific interaction. Unlike NPS (which works well for relationship-level surveys), CES captures the freshness of a single experience. Here are the key moments to deploy a CES survey:
After customer support interactions
This is the most common CES use case. Whether the interaction was by phone, live chat, email, or WhatsApp, sending a CES survey within minutes of resolution captures an accurate, emotionally fresh response. Use it to identify agents, channels, or issue types that consistently generate high effort.
After purchase or checkout
A high-effort checkout experience is a direct revenue leak. CES surveys post-purchase reveal whether your payment flow, account creation, or order confirmation process is causing unnecessary friction. Research shows 17% of customers abandon carts when checkout becomes too complex.
During onboarding
Poor onboarding accounts for 23% of average customer churn. CES during the onboarding phase pinpoints where new users are getting stuck, so you can fix the friction before it becomes a cancellation.
After self-service attempts
When customers try to resolve something through your knowledge base, FAQ, or chatbot, CES tells you whether those tools are actually working. High effort here signals that your self-service content needs improvement and customers are being forced to escalate unnecessarily.
After returns or refund requests
Returns are a loyalty acid test. A seamless return process can turn a negative experience into a demonstration of your brand’s trustworthiness. CES here identifies whether your returns policy is a strength or a hidden churn driver.
Customer Effort Score Benchmarks by Industry (2025)
One of the most common questions CX professionals ask is: “What is a good effort score?” The answer depends on the scale you’re using, the type of interaction, and your industry. Here’s a comprehensive benchmark table:
Industry | 5-Point Scale (Good CES) | 7-Point Scale (Good CES) | Key Drivers of Effort |
E-commerce / Retail | ≥ 4.0 | ≥ 5.5 | Checkout, returns, shipping support |
SaaS / Technology | ≥ 3.8 | ≥ 5.3 | Onboarding, product support, billing |
Telecom | ≥ 3.5 | ≥ 5.0 | Tech support, account changes |
Banking / Financial | ≥ 3.6 | ≥ 5.1 | Disputes, account management |
Healthcare | ≥ 3.3 | ≥ 4.7 | Scheduling, billing, insurance queries |
Travel / Hospitality | ≥ 3.8 | ≥ 5.3 | Booking, refunds, modifications |
B2B Services | ≥ 3.4 | ≥ 5.0 | Renewals, onboarding, escalations |
Source: Aggregated from Gartner, Nicereply CES Benchmark Report, Surveypal industry data, and Balto CES research (2023–2025).
What Is a Good Customer Effort Score?
On a 5-point scale: A score of 3.5 or above is generally considered good. Scores at 4.0+ indicate an excellent, low-friction experience. Anything below 3.0 signals urgent attention needed.
On a 7-point scale: A score of 5.0 or above is solid. Scores of 5.5–6.0 are excellent. Industry leaders often hover around 5.5 (e.g., the average CES for Nicereply’s support customer base is 5.5 on a 7-point scale). Scores below 4.5 warrant immediate investigation.
The Sweet Spot: Why 5–6 May Beat a Perfect 7
Some CX researchers argue that a perfect score of 7 can actually indicate customers are over-relying on your support team for issues that could be self-served. A score of 5–6 often reflects the healthiest balance: customers get effortless help when needed but also successfully use self-service tools.
The Real Benchmark: Your Own Trend Line
Industry averages give you a starting point, but your most meaningful benchmark is your own historical trend. Track CES scores over time. If your score improves quarter-over-quarter, you’re winning regardless of where you sit against industry averages. If your score is stagnating while you’re rolling out ‘improvements,’ that’s a critical signal to investigate what’s actually happening in the customer journey.
CES vs NPS vs CSAT: Which Customer Metric Should You Use?
These three metrics are often discussed together and frequently confused. Here’s how they differ and when to use each:
Metric | Measures | Question Type | Best Used For | Scale |
CES | Ease of specific interaction | Transactional | Identifying friction points, predicting churn | 1–5 or 1–7 |
NPS | Overall loyalty & advocacy | Relational | Long-term brand health, segment promoters/detractors | 0–10 |
CSAT | Satisfaction with specific moment | Transactional / Relational | Post-interaction satisfaction snapshot | 1–5 or 1–10 |
The key takeaway: these metrics don’t compete but compliment. Use CES to identify where friction occurs. Use NPS to understand who is at risk of churning. Use CSAT to measure how customers feel about specific moments.
A recommended CX stack: CES after every support interaction, CSAT after purchases and major service events, and NPS quarterly as a relationship health check.
Why Customer Effort Score Matters: The Business Case
CES isn’t just a feel-good metric it has a direct, measurable impact on business outcomes. Here’s the evidence:
94%
of low-effort customers intend to repurchase (Gartner)
81%
of high-effort customers spread negative word-of-mouth
37%
lower cost per interaction for low-effort vs high-effort experiences
CES and customer retention
According to Gartner, 96% of customers who have a high-effort service interaction become more disloyal, compared to just 9% who have a low-effort interaction. The math is stark: high-effort experiences fail to build loyalty
CEB research found that NPS is 65 points higher for top-performing, low-effort companies than for high-effort companies. Fixing effort isn’t a nice-to-have, it’s a strategic lever for retention and revenue growth.
CES and operational efficiency
Low-effort experiences make your business more efficient. A low-effort interaction costs 37% less than a high-effort one. Reducing friction reduces repeat contacts, escalations, and channel-switching which all drive up operational costs.
Specifically, CEB data shows that reducing customer effort can decrease:
- Up to 40% of repeat calls
- Up to 50% of escalations
- Up to 54% of channel switching
CES and employee retention
An often-overlooked benefit: when support reps consistently provide low-effort experiences, they feel better about their jobs. Gartner research shows that employee intent to stay increases by up to 17% when reps are empowered to resolve issues efficiently. CES is a retention tool for your team, not just your customers.
How to Improve Your Customer Effort Score: 7 Proven Strategies
Here are seven strategies used by CX leaders to systematically reduce customer effort:
Strategy 1: Avoid channel switching
Channel switching — where a customer starts an interaction on chat, gets transferred to phone, and has to explain themselves again — is one of the top drivers of perceived high effort. Map your customer journeys and identify where context is lost between channels. Deploy tools like Merren’s omnichannel survey platform to collect CES data across all touchpoints and pinpoint exactly where switching is occurring.
Strategy 2: Train for “next-issue avoidance”
Also called forward resolution, this technique involves training support agents to proactively address likely follow-up issues during a single interaction. This reduces the need for the customer to contact you again. Research shows this is one of the highest-ROI support interventions available, significantly reducing repeat contacts.
Strategy 3: Build better self-service options
Research consistently shows customers prefer to solve their own problems rather than contacting support, when self-service is easy. Invest in structured knowledge bases, AI-powered chatbots, and intuitive FAQ pages. Use CES specifically after self-service attempts to measure how well these tools are performing.
Strategy 4: Reduce resolution time
Customers associate effort closely with time. Long wait times, slow email responses, and lengthy hold music all drive CES scores down. Reduce Average Handle Time (AHT) and First Reply Time (FRT) by streamlining agent workflows, enabling better case routing, and providing reps with real-time support tools.
Strategy 5: Proactive communication
If customers have to reach out to ask “Where is my order?” or “What happens next?”, that’s a high-effort experience waiting to happen. Proactive order updates, shipping notifications, appointment reminders, and status emails pre-empt effort entirely. Customers who already have the information they need don’t have to work to get it.
Strategy 6: Streamline your checkout and onboarding
For product companies, checkout and onboarding friction are massive CES killers. Implement single-page checkouts, save payment preferences, and offer multiple payment options. For SaaS, design guided onboarding sequences with tooltips, in-app prompts, and contextual help to reduce the effort of getting started.
Strategy 7: Close the feedback loop immediately
CES data is only valuable if you act on it fast. When a customer scores a low CES, trigger an automatic follow-up: an apology, an offer to help, or an escalation to a senior support agent. Tools like Merren’s AI-powered CX platform let you set automated response workflows so no low-effort score goes unaddressed. Customers who see their feedback acknowledged become significantly more loyal.
Customer Effort Score Survey Questions: Best-Practice Examples
The best CES survey question is short, clear, and tied to a specific interaction. Here are proven templates:
For customer support interactions
“[Company name] made it easy for me to resolve my issue today.” (1–7 Strongly Disagree to Strongly Agree)
“How easy was it to get your question answered today?” (1–5 Very Difficult to Very Easy)
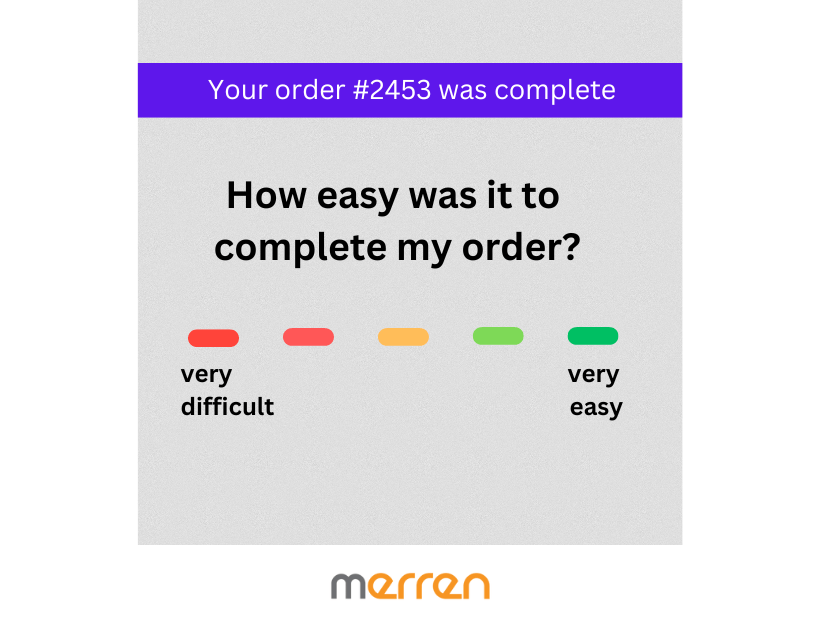
For post-purchase / checkout
“How easy was it to complete your purchase today?” (1–5 scale)
“[Company] made it easy for me to complete my order.” (1–7 Disagree/Agree)
For onboarding
“How easy was it to get started with [product/service]?” (1–5 scale)
Follow-up open-ended question (always include this)
Whatever scale you use, always add an open-ended follow-up: “What, if anything, made this experience difficult?” This qualitative layer tells you why scores are low — not just that they are.
📌 Pro Tip: Wording Matters Globally
The word “effort” can be misinterpreted in non-English languages and some cultural contexts. Use “easy” or “simple” for international surveys to ensure accurate, comparable responses across markets.
How to Measure Customer Effort Score with Merren
Setting up a CES program doesn’t require a complex, expensive enterprise platform. With Merren’s AI-powered customer experience platform, you can deploy a CES survey in minutes across the channels where your customers actually are.
Step 1: Choose your survey channel
Merren supports native WhatsApp surveys, Facebook Messenger surveys, email surveys, and chatbot surveys giving you access to the channels with the highest response rates. WhatsApp surveys in particular can achieve up to 10x the response rate of traditional email surveys, ensuring your CES data is statistically significant.
Step 2: Use a CES template
In the Merren dashboard, go to +Create a Survey, select a CES template, and customize the question wording and scale. You can launch your first CES survey in under five minutes.
Step 3: Set up automated triggers
Configure Merren to automatically send your CES survey immediately after a support ticket is closed, a purchase is completed, or onboarding is finished. Timing is everything — surveys sent within minutes of an interaction capture 40–50% higher response accuracy than those sent hours or days later.
Step 4: Monitor your CES dashboard
Merren’s real-time CX dashboard visualizes your CES scores by channel, agent, interaction type, and time period. You can identify trends, spot friction hotspots, and track your improvement over time all in one place.
Step 5: Close the loop automatically
Set up Merren’s automated workflows to flag low CES scores for immediate follow-up. When a customer scores below your threshold, your team is alerted instantly so you can recover the experience before it becomes a lost customer.
🚀 Ready to Measure Customer Effort Score?
Sign up for a 14-day free trial with Merren — no credit card required. Access all CES features, templates, and omnichannel survey channels from day one. Start reducing friction and building loyalty today.
Frequently Asked Questions About Customer Effort Score
What is the difference between CES and NPS?
NPS measures overall loyalty and the likelihood of a customer recommending your brand. CES measures the ease of a specific interaction. NPS is best for relationship-level health checks; CES is best for identifying transactional friction. The two metrics complement each other well when used together.
What is a good Customer Effort Score?
On a 7-point scale, a score of 5.0 or above is generally considered good, with 5.5+ being excellent. On a 5-point scale, 3.8+ is good. However, your most meaningful benchmark is your own trend over time — consistent improvement matters more than any single number.
How often should I measure CES?
CES should be measured after every relevant customer interaction not on a fixed schedule. Deploy it immediately post-support interaction, post-purchase, post-onboarding, or after any process where friction is a concern. Continuous measurement gives you the most actionable dataset.
Can CES predict customer churn?
Yes — CES is one of the strongest churn predictors available. Gartner research shows that 96% of customers with high-effort experiences become more disloyal. Tracking CES over time and monitoring for score drops at specific touchpoints allows you to intervene before a customer churns.
Should I use CES alone?
No. CES is a powerful metric for identifying friction points, but it doesn’t capture overall satisfaction (CSAT) or long-term loyalty (NPS). Use all three in combination for a complete picture of your customer experience health.
What is the customer effort score meaning in practice?
In practice, CES tells you whether your customers had to fight to get help or whether the experience was frictionless. A high CES score means your processes are working in the customer’s favor. A low CES score pinpoints exactly where customers are getting stuck — giving you a clear roadmap for improvement.
Start Reducing Customer Effort Today
Sign up for Merren’s 14-day free trial and launch your first CES survey in minutes. No credit card. No setup fees. Just better customer experiences.