
Customer recommendations can positively influence future sales. This is when people are willing to recommend your brand purely out of a good experience. This recommendation is measured by Net Promoter Score (NPS). NPS is a gold standard metric to gauge customer advocacy and loyalty. This simple yet powerful metric is a cornerstone of customer experience (CX) strategies across industries.
What determines a ‘good’ Net Promoter Score varies across industries. It depends on market maturity, customer expectations, and geographical and cultural factors.
What you’ll find in this guide:
- What is a good Net Promoter Score in 2026
- Updated NPS benchmarks across 12+ industries (with 2025 vs 2026 comparison)
- Global cross-industry averages from 150,000+ organizations
- B2B vs. B2C structural benchmark gap explained
- Regional NPS differences: US, Europe, Asia & Latin America
- What’s driving benchmark shifts in 2026
- Real brand NPS scores for 2026
- Actionable strategies to improve your score
What is Net Promoter Score (Quick Refresher)?
Net Promoter Score was introduced in 2003 by Fred Reichheld, a partner at Bain & Company.
The problem? Businesses were overwhelmed by complex customer satisfaction surveys. These surveys failed to translate into clear, actionable insights.
The solution? Reichheld created a simple, actionable metric that could reliably predict customer loyalty and, by extension, business growth.
His team identified that one key question:
“How likely are you to recommend our product or service to a friend or colleague?”.
It was strongly correlated with customer loyalty and future behaviour. This question became the foundation of the Net Promoter System methodology.
Customers respond to an 11-point NPS survey scale (scale of 0-10) , which categorizes them into three groups:
- Promoters (9-10): Promoters are loyal customers who drive growth by promoting brands they prefer.
- Passives (7-8): Passives are not enthusiastic customers but they’re vulnerable to competitors. However, they are just satisfied enough to use your products/services.
- Detractors (0-6): Detractors are unhappy customers. Dissatisfied customers can damage your brand through negative feedback, digital word-of-mouth.
What is a “Good” Net Promoter Score in 2026?
While NPS ranges from -100 to +100, their interpretation depends on your industry and market.
Score Range | Label | What It Means |
Below 0 | Needs Improvement | More detractors than promoters: urgent action required |
0–19 | Acceptable | More promoters than detractors: a baseline to build from |
20–29 | Good | Growing brand preference, more advocates than critics |
30–49 | Great | Customers are being consistently delighted |
50–69 | Excellent | Standout experiences: strong loyalty engine |
70+ | World-Class | Loyal fan base, exceptional brand advocacy |
Example: Apple is known for its memorable user experience right from the packaging to product usage. The tech giant consistently achieves NPS scores above 70. Meanwhile, average scores for industries like financial services or healthcare are significantly lower. It can reflect the unique challenges of those sectors.
Key global statistics for 2026:
- The all-industry average NPS is 32
- The all-industry median NPS is 44 (higher than the average because a handful of very low scores pull the mean down)
- The top 25% of companies score 72 or higher
- The bottom 25% score 0 or lower
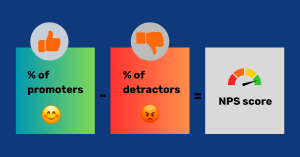
The Net Promoter Score (NPS) formula:
NPS = (% Promoters) – (% Detractors)
The scores range from -100 to +100, where a higher score indicates a healthier customer base.
Why does Net Promoter Score matter in 2026?
The Net Promoter Score is much more than just a number. It’s a reflection of your customers’ emotional connection to your brand.
- Predicts growth: Studies show that a high NPS correlates with revenue growth since promoters are more likely to repurchase and refer.
- Enhances CX strategies: By identifying promoters and detractors, businesses can refine their customer engagement strategies.
- Competitive benchmarking: NPS allows companies to see where they stand compared to industry peers.
- Actionable insights: Open-ended follow-up questions reveal the “why” behind the scores. You can make targeted improvements.
2026 NPS Benchmarks by Industry (vs. 2025)
Industry | 2025 Avg | 2026 Avg | Good Range | Top Performers | Example Companies |
SaaS / Tech | 41 | 44 | 40–55 | 60+ | Zoom, HubSpot, Slack |
E-Commerce / Retail | 36 | 45 | 40–55 | 60+ | Amazon (73), Chewy (68) |
Financial Services | 37 | 40 | 35–50 | 55+ | American Express, USAA |
Healthcare / Telehealth | 31 | 34 | 30–45 | 50+ | Teladoc |
Hospitality / Travel | 44 | 47 | 40–55 | 60+ | Marriott, Airbnb |
Telecom | 19 | 22 | 20–30 | 40+ | T-Mobile (82) |
Automotive | 45 | 48 | 40–55 | 65+ | Tesla (70–78), Toyota |
B2B Services | 33 | 36 | 30–45 | 50+ | Accenture |
Insurance | — | 80 | 55–80 | 80+ | American Family Ins. |
Consumer Electronics | — | 54 | 45–60 | 70+ | Apple (68–72), Samsung |
Construction | 37 | 42 | 35–50 | 55+ | (Rebounded in 2026) |
Cloud & Hosting | — | 40 | 35–50 | 55+ | AWS, Azure |
Key 2026 benchmark highlights:
- Construction rebounded sharply to 42 in 2026 after dropping to 34 in 2025. The most dramatic single-year recovery.
- Insurance leads all B2B categories at 80, driven by post-pandemic trust rebuilding.
- Consumer Electronics leads B2C at 54. Apple and Samsung ecosystem loyalty drives this.
- Property Management is a new entrant at 47, showing previously unmeasured industries entering the benchmark.
- Internet Software & Services improved to 26. Still below the median but trending upward.
- 10 out of 14 tracked industries showed an upward trend in 2025, continuing into 2026.
Pro tip:
A score of 35 can be excellent in telecom but mediocre in e-commerce. Always benchmark against your specific industry, not a universal standard. The raw number means little without context.
B2B vs. B2C NPS: The 11-Point Structural Gap
Segment | 2026 Avg NPS | Notes |
B2C Companies | 49 | Higher due to emotional brand bonds |
B2B Companies | 38 | 11-point structural gap vs B2C |
All Industries (Avg) | 32 | Global average across 150,000+ orgs |
All Industries (Median) | 44 | Median higher due to low-score outliers |
Top 25% of Companies | 72+ | World-class territory |
B2C brands average 49 vs. B2B at 38. This 11-point-gap is driven by the emotional nature of consumer brand relationships versus the more transactional, multi-stakeholder nature of B2B contracts. Don’t compare your B2B score to a B2C benchmark. It’s a different game entirely.
Regional NPS Differences: US, Europe, Asia & Latin America [Updated for 2026]
Region | Avg NPS Range | Key Driver |
North America (US & Canada) | 35–40 | High expectations, stricter scoring culture; Forrester noted 4th straight year of CX decline in 2025 |
Europe (EU) | 25–35 | GDPR-driven skepticism and cultural reserve suppress scores |
Asia (India, SE Asia) | 40–50 | Rapid digital adoption drives higher NPS in e-commerce & fintech |
Latin America | 45–55 | Stronger relational culture boosts loyalty scores significantly |
What’s Driving NPS Benchmark Shifts in 2026?
- AI-Powered Customer Support: Companies using AI for faster resolution are converting more detractors into passives and passives into promoters. Slower-to-adopt businesses are falling behind.
- Personalization at Scale: Brands leveraging CRM and behavioral data to personalize outreach see measurably higher NPS. Generic interactions are seen as a negative.
- Sustainability Expectations: Younger consumer cohorts actively reward eco-conscious brands with higher loyalty. This is especially visible in e-commerce and consumer goods.
- Price Sensitivity: Ongoing inflation pressure means customers are less forgiving of value mismatches. NPS can drop sharply if pricing feels unfair relative to the experience delivered.
- Digital Experience Quality: App performance, chatbot UX, and omnichannel consistency are now direct NPS drivers. A poor mobile experience is enough to turn a promoter into a passive.
- Post-Pandemic Realignment: Benchmark momentum is no longer uniformly positive. Some industries that rebounded strongly in 2024 are facing rising expectations in 2026. Maintaining a score requires more effort than ever.
2026 Industry-Specific Net Promoter Score Benchmarks
Here’s how industries stack up in 2026, with year-over-year shifts based on various benchmark studies:
Brand | 2026 NPS Score |
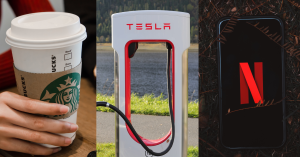
Tesla | 70–78 |
Apple | 68–72 |
Costco | 70–80 |
Amazon | 73 |
T-Mobile | 82 |
Chewy | 68 |
Netflix | 43 |
PayPal | 65 |
Starbucks | 30 |
Southwest Airlines | 47 |
Etsy | 56 |
Walmart | 30 |
Nutanix | 92 |
Nimble | 85 |
LoanBoox | 80 |
Here is what top scores have in common:
- Fast issue resolution: detractors are followed up personally
- Generous return and refund policies (Costco, Amazon)
- Humans available when it matters , not just bots
- Ecosystems that create switching costs through genuine value (Apple, Tesla)
Why do Net Promoter Score benchmarks vary?
- Customer expectations: In industries like hospitality, customers expect personalized, seamless experiences, which drives higher average scores.
- Nature of interactions: Healthcare and financial services often involve sensitive, high-stakes interactions that make achieving high NPS more challenging.
- Market saturation: Industries with intense competition (e.g. retail) often see more variability in NPS, as differentiation plays a significant role.
- Regional differences: Cultures across Asia will have growing expectations over markets set in North America. The same industry in Asia may have a higher NPS over those in Europe or North America.
How to Interpret Score from an NPS Survey?
The NPS survey results come with a context. Standalone numbers are less informative without understanding their implications and complementary metrics.
NPS in relation to other CSAT and CES
To get a fuller picture of your customer experience, pair NPS with:
- Customer Satisfaction Score (CSAT): Measures satisfaction with specific touchpoints or experiences.
- Customer Effort Score (CES): Gauges how much effort a customer must exert to resolve issues or achieve outcomes.
Example:
If your NPS is 50 but your CES is low, it could mean customers love your product but struggle with support services. Addressing this gap can improve overall loyalty.
How to Improve Your Net Promoter Score?
Strategies for retaining Promoters (scores 9-10)
- Incentivize continued loyalty: Implement loyalty programs that reward promoters with discounts, exclusive offers, or early access to new products and services. Encourage customers to for referrals to increase community participation. Sometimes, companies can also offer surprise incentives as a reward. Example: Airlines can choose a regular flyer with maximum air-miles. They can upgrade the customer with a business class seat upgrade.
- Actively engage on social media: Respond to user generated posts and feature their testimonials to strengthen the brand image.
- Invite to beta test: Involve promoters in beta testing new products or features. Use their feedback to improve and refine current offerings. This will make them feel valued to be a part of the inner circle.
Strategies for turn Passives to Promoters (scores 7 or 8)
- Initiate conversation: Talk to your customers about what is different or better in your brand. Learn about their requirements to understand what category of audience, passives fall under.
- Close the feedback loop: Sometimes the passives refuse to turn into advocates due to a genuine concern or shortfall on the promise. Understand this and address it. Communicate back to the customers of the changes you have made based on their feedback. This needs to be implemented on a continuous basis to make them feel valued.
- Nudge them for reviews: Asking for reviews can be a meaningful way to solicit advocacy. Nudge them by telling them why their testimonials matter and how it would help the brand within their network.
Strategies to protect reputation from Detractors (scores 0-6)
- Rapid response: Implement a system to swiftly respond to negative feedback. Empathetic response can sometimes turn a detractor into a passive or even a promoter. Offer solutions or compensation for their poor experience. This might include discounts, refunds, or other gestures that show goodwill.
- Follow-up post resolution: Ensure that the grievances are resolved to their satisfaction.Follow up to inform them about the steps taken to address their concerns. Transparency can rebuild trust.
- Touchpoint check-ins: After addressing first initial complaints, check in with detractors periodically to ensure they are satisfied with the solutions. You can use Customer Effort Score to assess the effort they went through while the problem was getting resolved.
- Focus on creating better experiences: Make sure that the company creates better, improved experiences for previous detractors. This can reinstate their faith in the brand and gain their trust.
Real-World Examples of Net Promoter Score Success
- Airbnb (Hospitality): Airbnb used NPS feedback to improve its host onboarding process, addressing common pain points and boosting host satisfaction. This led to a notable increase in their NPS.
- Zoom (Tech): By simplifying its user interface and providing 24/7 support, Zoom managed to significantly improve its NPS during the pandemic.
- Apple Inc: Apple customer service teams do not use pushy sales. They listen to the customer’s problems and suggest solutions around it. Even when people do not purchase, they are still invited to return for a free demo.
- USAA: USAA offers a quick customer redressal system of queries. This makes 64% of their customer base very satisfied with their service (which is more than the redressal system compared to other banks).
Tips to Maintain a Good Net Promoter Score
What is NPS decay?
Net Promoter Score (NPS) is dynamic and reflects the ongoing experiences and sentiments of your customers. However, the score will naturally “decay” over time. This decay occurs because customer expectations evolve, market conditions change, and competitors improve their offerings. A high NPS today does not guarantee a high NPS tomorrow if efforts to maintain and improve are not consistent or sustained.
What causes NPS to decay?
- Shifting customer expectations: As new technologies emerge and industry standards rise, customers begin to expect more. What delighted customers last year may only satisfy them this year, or worse, it may disappoint them.
- Competitor innovations: When competitors introduce new features, services, or improved customer experiences, your previously satisfied customers might reassess their loyalty based on competitor’s benchmarks.
- Market dynamics: Changes in the economic environment, such as recessions or fluctuations in consumer spending power, can alter customer perceptions and priorities. This impacts how they rate their likelihood to recommend.
- Internal stagnation: If a company fails to innovate or becomes complacent, its offerings may become outdated. Without continual improvement, customer satisfaction and their NPS scoring will naturally decline.
How to Improve Net Promoter Score?
Improving NPS metrics require a systematic approach that combines listening to feedback, taking action, and refining internal processes.
1. Close the customer feedback loop
Keep the teams ready in place to intercept negative feedback on websites, social media channels or on Google reviews. Get in touch with the reviewer and offer feasible solutions to ease the impact of the problem. Additionally, make sure you humanize the process and offer empathy.
2. Train and empower customer support teams
Your frontline teams play a pivotal role in customer satisfaction. Invest in continuous training to improve communication and problem-solving skills. Empower teams to handle issues and closing tickets without passing it on to the hierarchy. This autonomy can clear backlogs and offer a better customer experience.
3. Use data to identify and address pain points
Open-ended survey responses give insights into people’s feelings, experiences and unfiltered opinions. Assess qualitative responses to uncover recurring issues using Merren’s sentiment analysis. Introduce pulse surveys to track real-time sentiment. Use customer journey mapping to identify friction points and address them.
4. Offer personalized customer experiences
People value personalized interactions. For example, after using a car for 1000 miles, the customer might receive a complimentary check-up at a designated service point. To capture this data, leverage AI and CRM tools to tailor recommendations and communications. Reward loyalty with personalized rewards or exclusive content.
So You Have a Good Net Promoter Score. What Now?
Achieving a benchmark NPS metric can be a task. Maintaining the pinnacle of scores can be tougher in a growing market. Here is what brands can do to remain proactive with their CX strategies.
- Net Promoter Score will not keep increasing
NPS will rise gradually and will come to halt or maintain an equilibrium. This does not mean the products are bad or the brand is losing its market hold. Loyal brand advocates sometimes no longer find it important to offer customer feedback. They just continue being happy customers.
Continue upgrading products or offerings
There can be two ways to look at a product. If it can be improved, it must be improved. If there is no room for improvement and sales are down, it can be replaced with a new product or offering that is relevant in the modern marketplace. This will keep current customers happy and attract potential buyers.
Seek intentional feedback across survey channels
Continue taking feedback from people across various touchpoints such as onboarding, post-purchase service etc. This makes people feel valued and understand that the company thrives on customer feedback, even at scale. This will make people a brand advocate.
Offer apt upgrades and incentives
Offering surprise upgrades or incentives can result in customer-delight. A complimentary service, an upgrade to a business class in flight, giving exclusive invitations to patrons can make people seen and valued.
Frequently Asked Questions About Net Promoter Score
What is the highest possible NPS score?
The theoretical maximum is +100. In practice, very few companies score above 80. Tesla (70–78), Costco (70–80), and niche B2B platforms like Nutanix (92) are among the highest verified scores in 2026.
What is a good NPS for SaaS in 2026?
A good SaaS NPS in 2026 sits between 40–55, with top performers reaching 60+. The SaaS industry average is 44 and the median is 30. B2B SaaS specifically clusters around 36 — so 40+ is a strong target for most SaaS companies.
How often should I measure NPS?
Quarterly or bi-annually for relationship NPS. Monthly pulse surveys for real-time tracking. Transactional NPS (tNPS) should run automatically after major touchpoints: onboarding, purchase, and support ticket resolution.
Should I be worried about a negative NPS?
Not immediately but act quickly. A negative score means more detractors than promoters and indicates real customer experience issues. The insights from detractor feedback are actually your most valuable improvement data. Focus on understanding the why before fixing the what.
Can NPS replace CSAT or CES?
No. NPS measures overall loyalty and advocacy. CSAT measures satisfaction at a specific moment. CES measures how much effort a customer has to exert. All three together give a complete picture, none should be used alone.
What’s the difference between absolute NPS and relative NPS?
Absolute NPS is your raw score (e.g., 42). Relative NPS is where you stand compared to your industry peers. A 42 is excellent in telecom but below average in insurance. Always use relative benchmarking for goal-setting. Absolute scores without industry context can mislead you.
Conclusion
In 2026, a good Net Promoter Score depends on three things: your industry, your region, and how quickly you adapt to rising customer expectations. Opt for a 14 day free trial without any credit card commitments. You can view our extensive survey templates here. Customize it as per your industry requirements.