
Net Promoter Score (NPS) Meaning
In customer experience (CX), the Net Promoter Score (NPS) is a market standard metric that quantifies the likelihood of customers recommending your product or service. This score is derived from a single survey question: “On a scale of 0-10, how likely are you to recommend our company to a friend or colleague?”
The responses are categorized into three groups: Promoters, Passives, and Detractors.
Promoters (9-10): Promoters are loyal and enthusiastic customers who are most likely to recommend your product or service to others. They are satisfied with their experience and are likely to continue using your product or service.
Passives (7-8): Passives are customers who are satisfied but not enthusiastic. They are unlikely to spread negative word-of-mouth, but they are also not likely to actively promote your product or service.
Detractors (0-6): Detractors are unhappy customers who are likely to impede growth through negative word-of-mouth. They are not satisfied with their experience and are unlikely to recommend your product or service to others.
Understanding these categories is essential for CX executives in US SMEs. Promoters are your brand advocates, passives are potential, promoters with the right strategies, and detractors are opportunities for improvement. By focusing on these groups, you can tailor your CX strategies to improve your NPS.
Calculating the Net Promoter Score (NPS)
The net promoter score (NPS) formula is calculated by subtracting the percentage of Detractors from the percentage of Promoters. This score can range from -100 to +100. A positive score indicates that you have more Promoters than Detractors, while a negative score indicates the opposite.
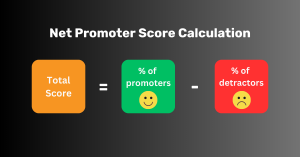
The formula for calculating NPS is as follows: [ NPS = % (of Promoters) – % ( of Detractors)]
For example, if 60% of respondents are Promoters and 20% are Detractors, your NPS would be 40. This score indicates that you have a significant number of loyal customers who are likely to recommend your product or service.
However, it’s important to note that NPS is not just a numerical value. It’s a reflection of your customers’ experiences and their willingness to recommend your product or service. A high NPS indicates that you are providing a positive customer experience, while a low NPS indicates that there are areas for improvement.
For CX executives in US SMEs, understanding how to calculate NPS is just the beginning. The real value comes from using this score to improve your customer experience strategies. By focusing on the factors that influence NPS, such as customer expectations, product/service quality, customer support, and brand loyalty, you can strategize for improvement and ultimately drive growth.

The NPS is calculated by subtracting the percentage of Detractors from the percentage of Promoters. The score ranges from -100 to +100. A positive score indicates that you have more Promoters than Detractors, which is generally considered good. A score of 0 means that you have an equal number of Promoters and Detractors, which is not ideal. A negative score indicates that you have more Detractors than Promoters, which is a clear sign that your customer experience needs improvement.
It’s important to note that the NPS is not just a number, but a reflection of your customer experience. A high NPS indicates that you have a strong customer experience that is driving growth, while a low NPS indicates that your customer experience needs improvement. Therefore, it’s essential to regularly measure and track your NPS to understand how your customer experience is evolving and where improvements can be made.
What is Considered A Good NPS Score?
A good NPS score can vary significantly between industries, but there are some general benchmarks that can be used to gauge the quality of your score. Generally, a score greater than 0 is considered good, as it indicates that you have more promoters than detractors. A score greater than 20 is favourable, while a score greater than 50 is considered excellent. A score greater than 70 is exceptional and indicates that you have a world-class customer experience.
These benchmarks are just guidelines and that the quality of your NPS score should be evaluated in the context of your industry and customer expectations. For example, a score of 50 may be exceptional in one industry but only favourable in another. Therefore, it’s essential to benchmark your NPS against industry standards to understand how your customer experience compares to your competitors.
In 2024, the average NPS across industries is expected to be +32, according to SurveyMonkey. However, this can vary significantly between industries. For example, in the B2B industry, typical average scores range between +25 to +30, while in the B2C industry, scores often range between +30 to +50. Therefore, it’s essential to understand the benchmarks for your specific industry to accurately evaluate the quality of your NPS score.
NPS benchmark for 2025 to 2026
Benchmarking against industry standards is a crucial step in understanding your Net Promoter Score (NPS). It provides context to your score and helps you gauge your performance relative to your competitors. In 2025, the average NPS across industries is broadly recognized as being in the range of +30 to +40, with the middle of that band (~+35) often cited as a realistic baseline for U.S. SME CX teams. This benchmark can serve as a starting point for CX executives in U.S. SMEs to evaluate their NPS.

When it comes to industry-specific benchmarks, the typical average NPS for B2B industries now ranges around +30 to +35 (versus +25 to +30 previously). These industries often involve long-term relationships and complex solutions, which temper extreme customer advocacy. On the other hand, B2C industries now typically see NPS scores in the ballpark of +30 to +50, with many strong performers reaching into the +50s. These industries are often characterized by shorter customer lifecycles and a greater emphasis on customer experience.
These benchmarks are not static and can vary based on a multitude of factors. Changes in market conditions, customer expectations, and industry trends can all influence NPS scores. Regularly review and update these benchmarks to ensure they remain relevant and accurate.
Moreover, while benchmarking can provide valuable insights, also consider your company’s unique context. Factors such as your business model, target audience, and competitive landscape can all impact your NPS. Therefore, while benchmarks can serve as a guide, they should not be the sole determinant of what constitutes a good NPS score for your company.
Factors Influencing NPS Scores
Several factors can influence your Net Promoter Score (NPS), and understanding these can help you improve your score. One of the most significant factors is customer expectations. Higher customer expectations can lead to lower NPS scores, as customers may be less satisfied with your product or service if it doesn’t meet their high standards.
Another critical factor is the quality of your product or service. This directly impacts customer satisfaction and, consequently, your NPS. If your product or service meets or exceeds customer expectations, they are more likely to recommend your company to others.
Customer support also influences NPS scores. Prompt and effective support can significantly boost your NPS, as it demonstrates your commitment to customer satisfaction. On the other hand, poor customer support can lead to lower NPS scores, as it can leave customers feeling frustrated and dissatisfied.
Brand loyalty is another factor that can impact your NPS. Strong brand relationships can yield higher NPS scores, as loyal customers are more likely to recommend your company to others. Therefore, building and maintaining strong relationships with your customers is essential for improving your NPS.
In addition to these factors, it’s important to consider the context in which your NPS is measured. For instance, your NPS may be influenced by factors such as the time of year, recent changes in your company, or industry trends. Therefore, it’s essential to consider these contextual factors when interpreting your NPS.
Relative NPS vs. Absolute NPS
Understanding the difference between relative and absolute NPS is crucial for CX executives in US SMEs. The absolute NPS is the raw score that reflects your company’s performance. It is calculated by subtracting the percentage of detractors from the percentage of promoters, as previously mentioned. This score provides a snapshot of your current standing, but it doesn’t tell the whole story.
On the other hand, relative NPS is a comparative measure that gauges your competitiveness within your industry. It involves comparing your NPS against industry benchmarks. This comparison is essential because a good NPS score can vary significantly between industries. For instance, a score that might be considered excellent in one industry could be just average in another.
Example: Two hypothetical companies, Company A and Company B, both with an absolute NPS of +40. Company A operates in the tech industry, while Company B is in the healthcare sector. Despite having the same absolute NPS, their relative NPS would differ due to industry standards. Given that the tech industry often scores between +50 to +70, Company A’s relative NPS would be less favorable. Conversely, since the healthcare industry typically sees scores between +10 to +40, Company B’s relative NPS would be more impressive.
Therefore, it’s not enough to simply aim for a high absolute NPS. CX executives must also consider their relative NPS to understand their standing within their industry. This understanding can help them strategize for improvement and set realistic goals.
Industry Variation
The Net Promoter Score (NPS) varies widely across industries, making it essential for CX executives in US SMEs to understand their industry’s specific context. Here, we delve deeper into the NPS variations across three key sectors: tech, retail, and healthcare.

Tech Industry
The tech industry often sees NPS scores between +50 to +70. This range is attributed to the sector’s focus on innovation and customer obsession. Tech companies are known for their commitment to delivering cutting-edge products and services that meet and exceed customer expectations. They also prioritize customer support, providing prompt and effective assistance, which boosts their NPS.
Retail Industry
The retail industry typically sees NPS scores around +20 to +60. These scores are driven by consumer experiences, which are heavily influenced by factors such as product quality, pricing, and customer service. Retail companies that can consistently deliver high-quality products at competitive prices, coupled with excellent customer service, are likely to have higher NPS scores.
Healthcare
The healthcare industry tends to have more modest NPS scores, usually between +10 to +40. These scores reflect the complexity and emotional engagement inherent in healthcare services. Patients often have high expectations and emotional investments in their healthcare experiences, making it challenging for providers to meet these expectations consistently. However, healthcare providers that can deliver high-quality care, demonstrate empathy, and provide clear communication are more likely to have higher NPS scores.
Understanding these industry variations is crucial for CX executives in US SMEs. It allows them to benchmark their performance against industry standards and set realistic goals. Moreover, it helps them identify areas for improvement and tailor their strategies to their specific industry context.
Aggregated Data and Global Benchmarks
Aggregated data and global benchmarks are crucial in understanding the broader context of your Net Promoter Score (NPS). By leveraging aggregated data, you can gain insights into wider trends and patterns that may not be immediately apparent from your own data. This can help you identify areas for improvement and opportunities for growth.
Aggregated data is the result of combining data from multiple sources to create a larger, more comprehensive dataset. In the context of NPS, this could involve pooling data from multiple companies within the same industry or across different industries. This can provide a more accurate representation of the overall customer experience landscape, helping you to benchmark your performance against a wider range of competitors.
Global benchmarks, on the other hand, provide a broader perspective on NPS. They take into account regional differences, cultural nuances, and market variations that can significantly impact customer expectations and perceptions. For instance, customer expectations and satisfaction levels can vary greatly between regions such as North America, Europe, and Asia. Understanding these differences can help you tailor your customer experience strategies to better meet the needs and expectations of your target audience.
Moreover, global benchmarks can also help you identify best practices and innovative strategies being employed by companies in different regions. This can inspire new ideas and approaches to improve your own NPS. For example, a company in the tech industry might look to the retail industry for inspiration on how to create more engaging and personalized customer experiences.
Incorporating aggregated data and global benchmarks into your NPS analysis can provide a more holistic and nuanced understanding of your performance. It can help you identify trends, benchmark against a wider range of competitors, and gain insights into best practices from around the world. This can ultimately help you improve your NPS and enhance your customer experience strategies.
Conclusion
In conclusion, a good NPS score is not a one-size-fits-all metric. It varies significantly between industries and is influenced by a range of factors, including customer expectations, product/service quality, customer support, and brand loyalty. Therefore, it’s essential to assess your NPS against industry benchmarks and understand the factors influencing your score.
For more insights on NPS and customer experience strategies, discover Merren. Merren CX provides a wealth of resources and tools to help you understand and improve your NPS, and ultimately, enhance your customer experience.